This is the second article on ICODOG’s latest series, “Trading cryptocurrencies successfully”, which focuses on the main investment strategies to trade the latest sensation in the world’s asset market, cryptocurrencies.
The first article, “All you need to know about Fundamental Analysis of cryptocurrencies in 2019” highlights the unique factors to consider while carrying out the long term analysis of digital assets. This article focuses on the short term analysis of price movements in cryptocurrencies and the various types of indicators chartists use to make future predictions.
“Technical analysis is a trading discipline employed to evaluate investments and identify trading opportunities by analyzing statistical trends gathered from trading activity, such as price movement and volume.” – Investopedia
All the jargon above is easily explained as evaluation of price charts and determining the future price of an asset such as a stock, currency, commodities and cryptocurrencies. Technical analysts base their predictions on an assumption that the price of an asset moves in a predictable pattern and is not completely random. Here are some of the assumptions technical analysts make while predicting the future price:
- The price reflects all available information on the asset
“The market discounts every information.”
Technical analysis differs from the fundamental analysis as it considers the price only as the determinant of future price. These traders believe that the price reflects all available information on the asset including the fundamental, economic and behavioral factors. The assumption further states that to make a future prediction of price, you only need the demand and supply statistics and the historical prices.
- History repeats itself
“Nothing new under the sun [market]”
The analysis of charts takes up the notion that past trends and price movements are set to repeat themselves in the future. These analysts attribute the assumption to overall market behaviors and predictable emotions such as fear, confidence, and ambiguity. The technical analysis aims to leverage the psychology of the market to understand the trends and movements in price to make future predictions.
- Asset prices move in predictable trends
“Long, medium and short term trends”
This final assumption is mostly used in predicting future prices of traditional assets rather than digital assets. It states that prices are likely to follow a past trend which is stable rather than an unpredictable sharp movement. The prices of cryptocurrencies in the past 2 years have behaved uncharacteristically such as to critic this assumption.
Outline
- Types of indicators
A. Overlays
· Price trend lines
· Support and resistance levels
· Moving Averages
B. Oscillators
· Relative Strength Index
· Stochastic oscillator - The importance of technical analysis indicators
- Limitations of technical analysis in cryptocurrency price predictions
- Conclusion
Types of indicators
Traders that use technical analysis have various unique strategies that can be categorized into the following major indicators;
A. Overlays
These indicators are those that appear on the main price chart. Some of the examples include;
· Price trend lines
Price trend analysis focuses on predicting the short, intermediate or medium-term movement of the price of a cryptocurrency. This method is popular to most traders who believe that moving with the trend, whether a bull run or bear run, will help you make profits and avoid losses. This analysis revolves around predicting if the current trend will continue and how long it will take before a reversal occurs.
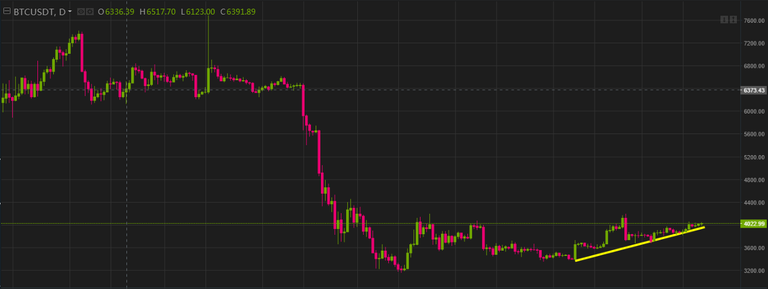
An upward trend shown on the daily BTC/USDT charts
· Support and resistance levels
Support and resistance levels are used by technical analysts to measure the levels of demand and supply of a token among investors. The support level represents the floor of the price and signals an increasing demand for the digital asset hence an upcoming bullish run. Resistance represents the ceiling of the price momentum and signals a decrease in the demand of a particular coin, hence an upcoming bear run.
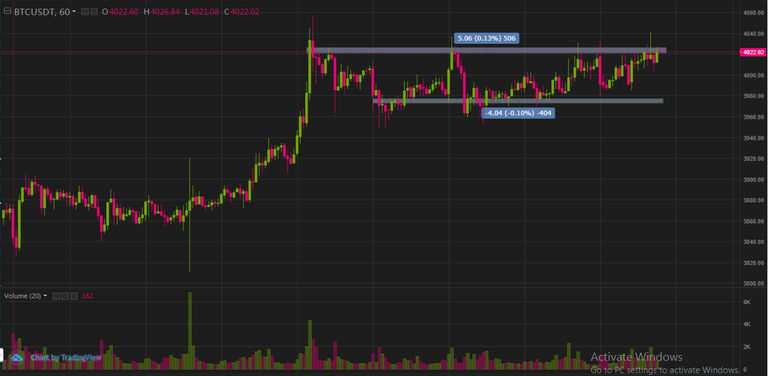
Illustration of support and resistance levels
· Moving Averages
Moving averages, simply abbreviated MA, are indicators that follow trends and help traders notice a reversal in a trend. MA reveals the average price of a tradable instrument over a given period of time. There are two major types of moving averages used by technical analysts in cryptocurrency trading namely simple and exponential moving averages.
B. Oscillators
These indicators are usually off the main price chart and move up and down between an upper and lower limit with a midpoint.
· Relative Strength Index
This indicator is used to measure the current sentiment in the market given the current period’s prices. The index signals an overbought region if it crosses the upper limit and oversold if it crosses the lower bound. If the RSI crosses the upper limit, it further signals an upcoming bear run while across below the lower limit signals an upcoming bullish momentum.
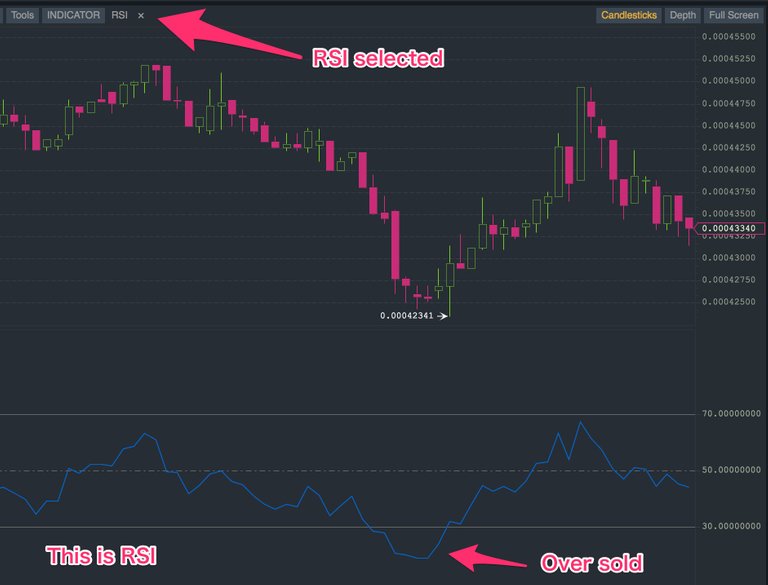
The RSI indicator
· Stochastic oscillator
Similar to the RSI, the stochastic oscillator allows traders to know if the cryptocurrency is overbought or oversold. The stochastic oscillator uses the support and resistance levels to make more accurate predictions on the future price. However, the calculations of the indicator factors in the highest and lowest prices for a given period hence gives false signals during a price breakout or sharp fall.
The importance of technical analysis indicators
Indicators are important in technical analysis as they help traders;
- Predict the future price of a cryptocurrency.
- Confirm the predictions of the future price of a digital asset.
- Alert the trader in case of any reversals in price.
Limitations of technical analysis in cryptocurrency price predictions
Technical analysis offers a clear picture in the short term analysis of the price of an asset. However, there are some limitations to technical analysis:
Efficient markets hypothesis– This hypothesis states that in an efficient market all information is reflected on the price hence you cannot make a profit through mispriced assets. Technical analysis works in a weakly efficient market.
Ouroboros– The fundamentalists argue that technical analysis is a short term game that benefits the strategy adopted by most traders. If a large number of traders select the same strategy and place a stop loss that is executed at the same price, the markets will show a bearish trend to which more investors will sell to follow the trend. A never-ending cycle in technical analysis.
Conclusion
These represent the major technical indicators in use today among the many thousands of indicators available. In our upcoming articles in the series, “Trading cryptocurrencies successfully”, we will discuss the technical analysis indicators above in more detail.