Let's Breakdown This Chart
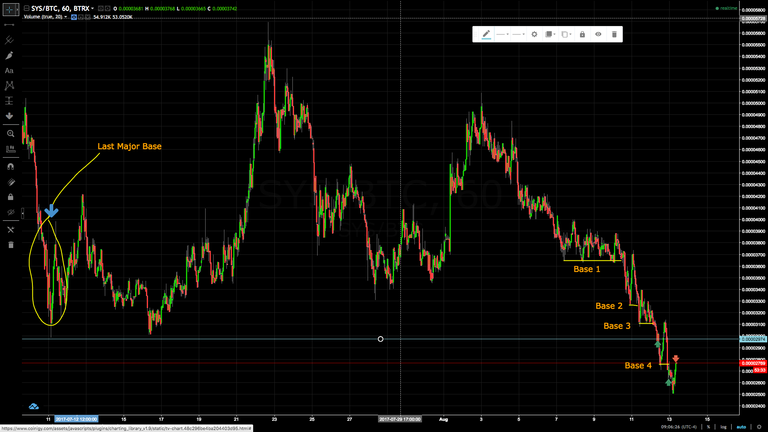
Ok, first things first....you'll notice that this is an hourly chart that shows 1 month of price action. To the far left, I've drawn a circle around the last major base that occurred on this chart. Directly under the tail of this base is where I placed my alert for this chart about 2-3 weeks ago (look at the blue horizontal line).
Now let's fast forward into the future...to the far right you'll notice a succession of bases being broken and price bouncing right back to the base and even surpassing it a bit. Once my alert went off, I bought a little bit around the 0.00002974 level. My major buy-in was near the 0.00002600 level and I sold a bit for profit taking around the 0.00002769 level.
Happy Trading!
Hell of a catch!