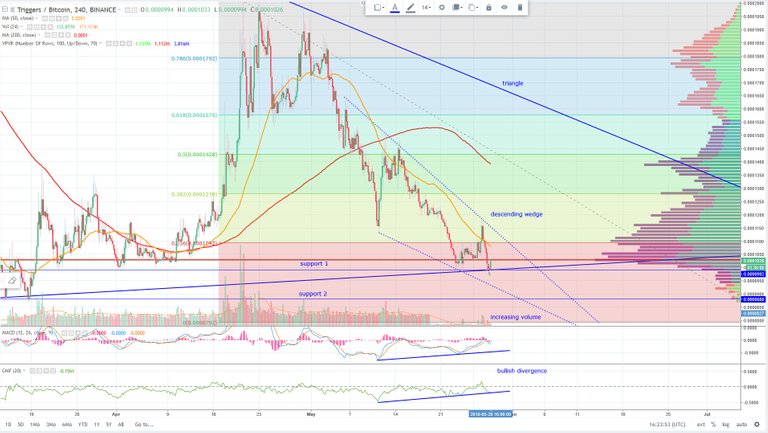
Hi my friends, here is Triggers chart.
- Price is currently at an important support.
- Price is inside descending wedge ( bullish pattern ) and on the botom of the blue triangle.
- Both technical indicators show bullish divergence .
- I expect bounce from the blue trendline to support 0.0001160 (first target)
Majkee
(I am sorry for my English)
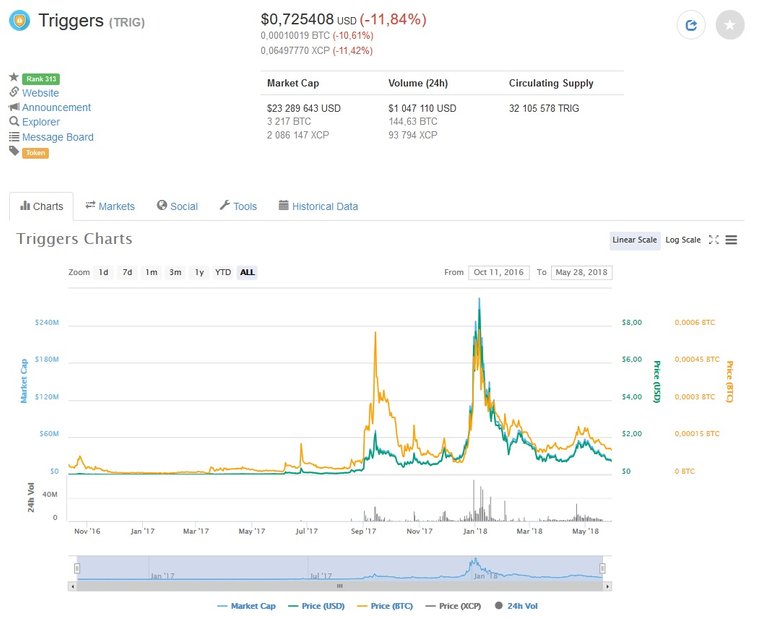
Analysis done shows that this is the period where the fall in price has not yet reached it bottom. It's advisable that investors hold on till the fall in price is at its bottom peak and then they can invest. Forecast is about the rise in bitcoin in the middle of June 2018 and shall be a run away kind of spike.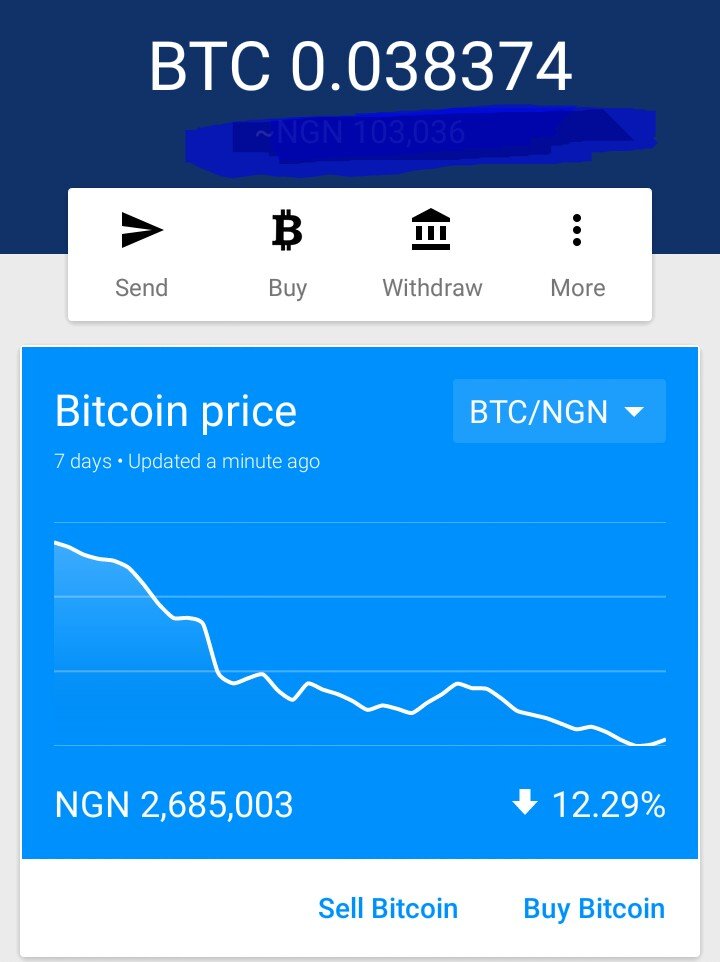
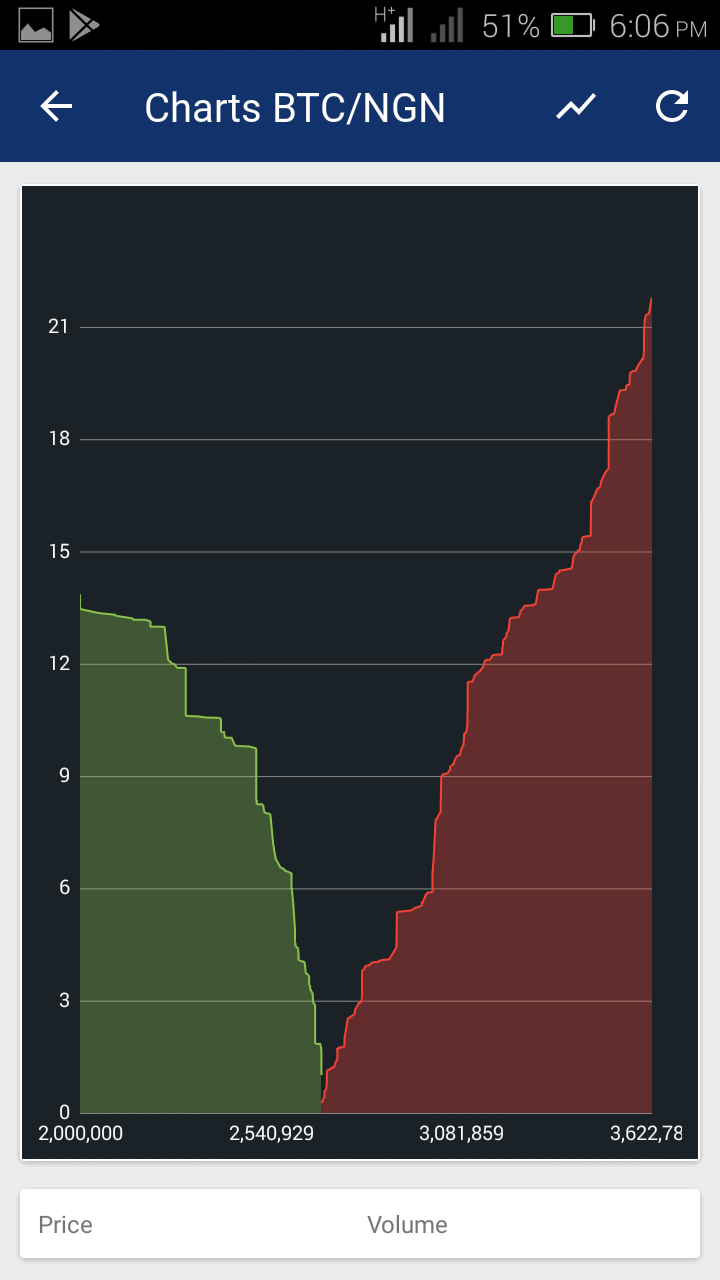
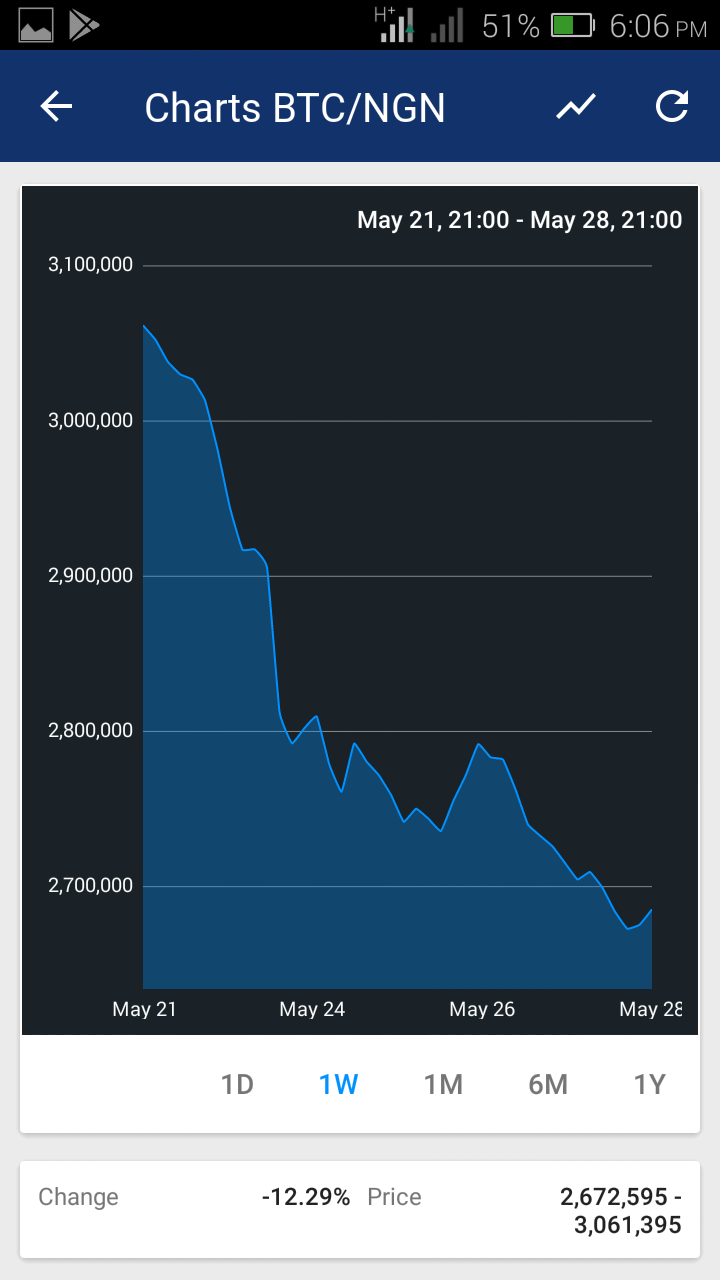
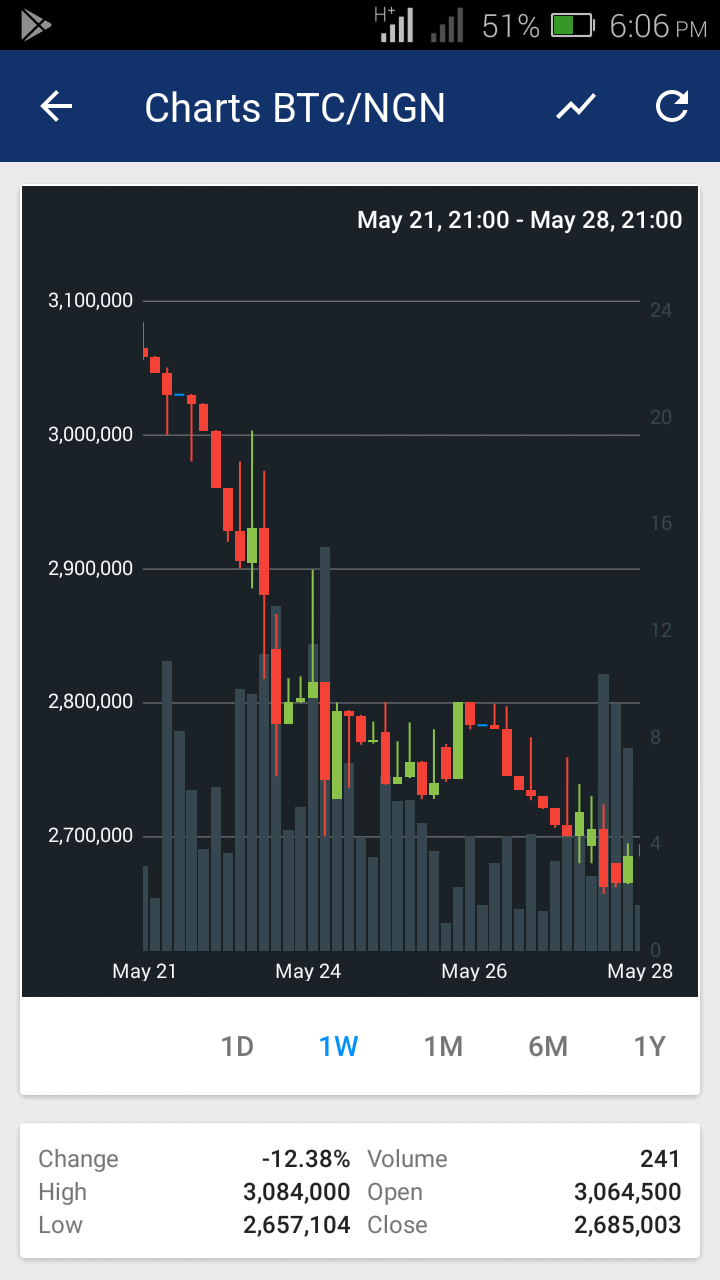
Chart:
NGN =naira currency
Where NGN 2,688,912= $7,217