Recent price movement puts Bitcoin back on a price rising scenario.
Ethereum and XRP, with fewer profits, get better setups than Bitcoin for the medium term.
Volatility may increase sharply in the short term.
In my Friday article, the headline request the Bitcoin to take advantage of the unique opportunity to get out of the technical breakage problem it was in.
A few hours later, Chinese Prime Minister Xi Jinping pointed out the blockchain technology as a strategic objective of the country and betting on leading its adoption by the vast Chinese economy.
The impact was immediate, with a massive increase in WeChat searches for the term Blockchain.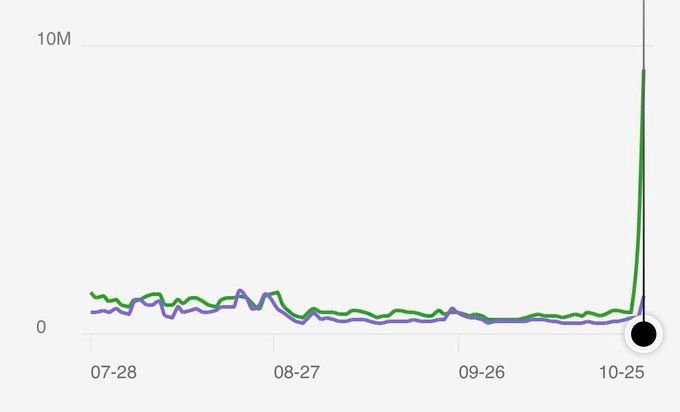
The most benefited by the surprising announcement are, Bitcoin apart, Altcoin projects with Chinese origin, such as EOS, TRX or ONT with increases of the order of 30% today.
The reaction in the Bitcoin quotation is spectacular. Extreme rises, in some moments above 30%, which took the BTC/USD pair out of the high-risk bearish scenario.
But has the movement to take Bitcoin out of the bearish scenario been effective? Indeed, although it has not managed to beat $9,650 at the close, so it remains in an intermediate zone, turbulent in between.
If there is no close above the SMA200 on daily charts, we can expect intense price swings.
ETH/BTC Daily Chart
The ETH/BTC pair has suffered significant declines due to the Ethereum's inability to keep up with King Bitcoin. The pair lost the EMA50 and the SMA100 on Friday, and the price dropped the 0.020 level.
The pair is currently trading at 0.01942.
Below the current price, the first resistance level is at 0.020, the second at 0.021 and the third one at 0.022.
Above the current price, the first support level is at 0.0187, then the second at 0.018 and the third one at 0.0173.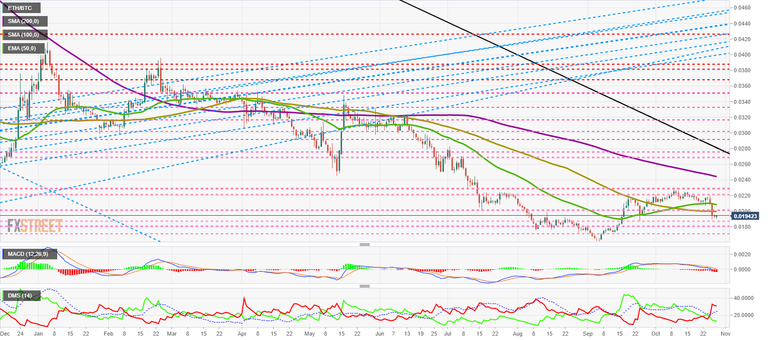
The MACD on the daily chart shows how the moving averages increase the bearish profile as well as the amplitude between the lines. The indicator enters the bearish zone and worsens the pattern in the short term.
The DMI on the daily chart shows how the bears are reacting very strongly to the bullish trend. The bulls moved down and lost the 20 level that signals an ongoing trend.
BTC/USD Daily Chart
The BTC/USD is currently trading at the $9,378 price level and marks the third day in a row that it is unable to close above the SMA200, which is trading at $9,650.
Above the current price, the first resistance level at $9,650, then the second at $10,550 and the third one at $11,300.
Below the current price, the first support level is at $9,150, then the second at $8,900 and the third one at $8,450.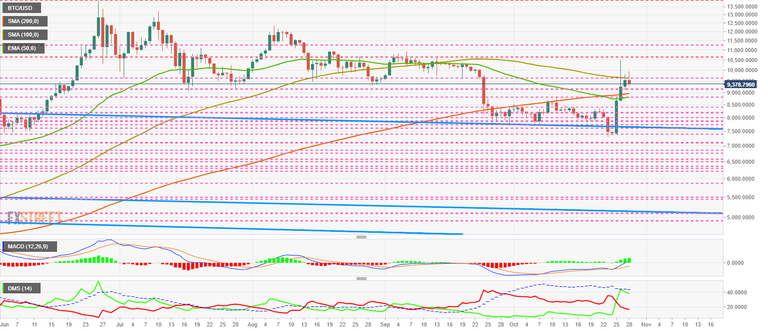
The MACD on the daily chart increases its bullish profile and also the distance between moving averages. The averages enter slightly into the bullish zone, subtracting some strength from the momentum.
The DMI on the daily chart shows a worrying signal that needs to be watched closely. Bulls go up with a lot of force but are unable to overcome the ADX line, a sign that there is more resistance than it may seem.
XRP/USD Daily Chart
The XRP/USD is currently trading at the $0.2978 price level and confirms that the price level to be beaten is $0.30. While last week's price declines strongly affected the XRP price, it doesn't look like the declines are working as well.
Above the current price, the first resistance level is at $0.30, then the second at $0.31 and the third one at $0.32.
Below the current price, the first support level is at $0.295, then the second at $0.29 and the third one at $0.285.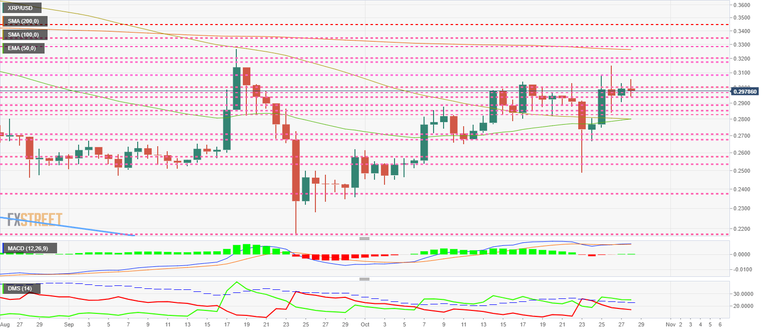
The MACD on the daily chart appears completely flat with hardly any distance between the lines. It gives us a clear picture of the situation and development in the short term. Active volatility chapters are likely to appear in the XRP/USD pair.
The DMI on the daily chart shows how the bulls manage to stay above the ADX line and even improve from last week's levels. The bears fall below the 20 levels of the indicator and propose to continue to fall.
Source
Plagiarism is the copying & pasting of others work without giving credit to the original author or artist. Plagiarized posts are considered fraud.
Fraud is discouraged by the community and may result in the account being Blacklisted.
If you believe this comment is in error, please contact us in #disputes on Discord
Hi! I am a robot. I just upvoted you! I found similar content that readers might be interested in:
https://www.fxstreet.com/cryptocurrencies/news/top-3-price-prediction-btc-eth-xrp-china-breaks-the-bank-with-their-bet-on-blockchain-201910281019
Congratulations @marcomarchesi! You have completed the following achievement on the Steem blockchain and have been rewarded with new badge(s) :
You can view your badges on your Steem Board and compare to others on the Steem Ranking
If you no longer want to receive notifications, reply to this comment with the word
STOPVote for @Steemitboard as a witness to get one more award and increased upvotes!