I am going to keep this one simple.
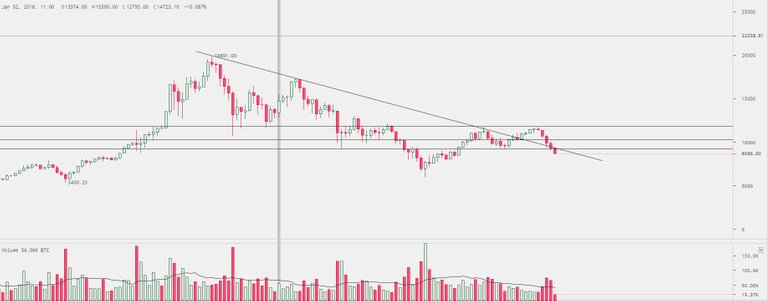
BTC did break out of the downtrend, but did not have much momentum. Fizzled out after hitting the nearby resistance at 11800 and then dropped. It is now below the 9300 support (although the daily candle has not closed). I am eyeing the 8000 level and after that there doesn't appear to be much noise until 7000
Please open chart in new tab for clearer view.
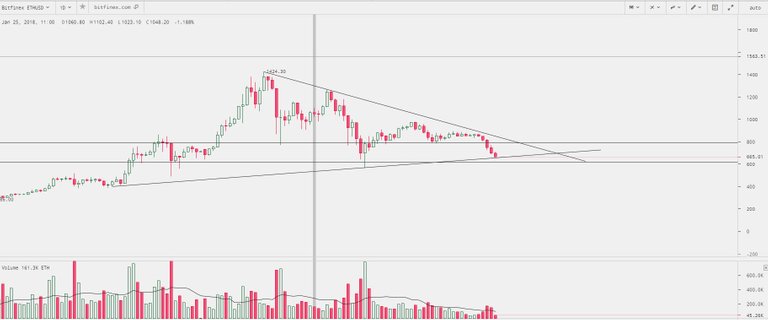
ETH had been trading flat for a while but with the downturn has also fallen through support levels. Note my trend lines are not valid yet in my opinion. I look for three touches as three points are fairly obvious. If they are obvious lines then most people can see them hence validating the trend.
The upward trend is touching the third point but because the day hasn't closed I am not counting it yet. If it falls form here, I am eyeing 600. I have been accumulating since the downward break of 800.
Good Job Fri...
Both getting crushed even more now