
Bitcoin has a very good momentum since November 13, 2017, where prices rose rapidly from $ 5,886 to reach the highest price of $ 19,982 on December 17, 2017 and then experienced a fairly sharp decline to date.
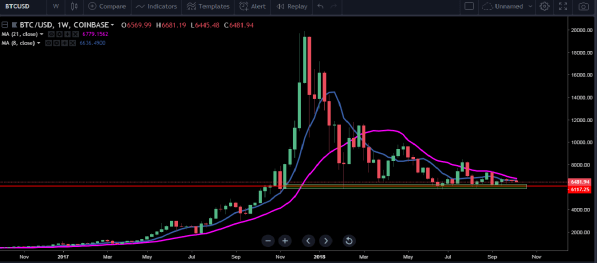
However, in terms of technical analysis and images from Weekly Timeframe as above, it can be said that Bitcoin prices repeatedly touched the price level at $ 5,886 and its surroundings (green area). This area is a very important area because "Bears" try to penetrate this level, however, "Bulls" are also not less powerful at that level. We can call this Area Zone the 'Supply and Demand zone'.
According to technical analysis, as long as BTC can still hold above the $ 5,886 level, the decline in prices that occurred since December 17, 2017 is just a "Pullback" that occurred from a sharp increase that began on November 13, 2017.
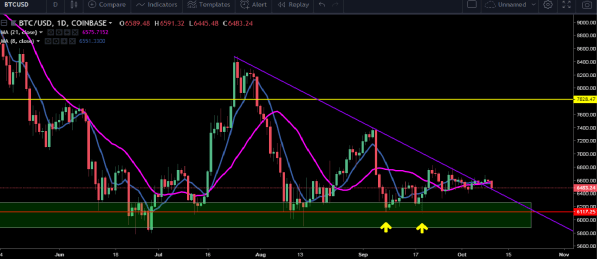
In this timeframe there are 2 important things happening to anticipate the short-term price movement of BTC.
- The downline of the trendline has been broken
- The occurrence of "Double bottom" formation (yellow arrow) in the important support level on Weekly Timeframe
Of these 2 points indicate that the momentum "Bears" has been reduced and "Bulls" is starting to show its momentum. BTC will likely rise to touch the first resistance level of $ 7,828.
Points to understand:
- Trend - Weekly Timeframe (Bullish)
- Green Box Area - Supply and Demand Zone
- Support Level - $ 6117 (red line)
- Resistance Level - $ 7828 (yellow line)