Hello Steemit!!!!!!!!!!!!!!
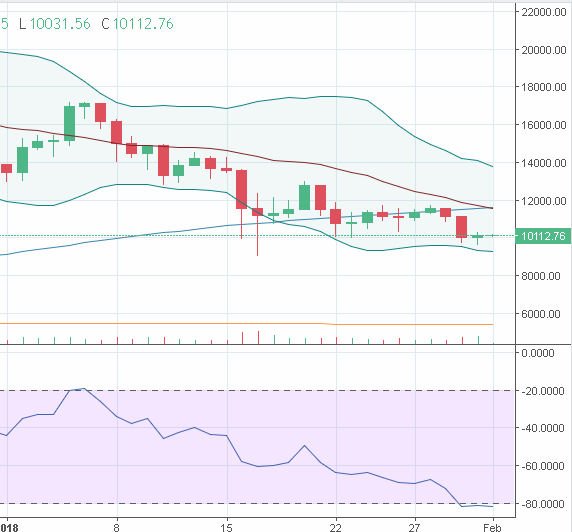
Bitcoin
Sell signal, from two days ago, still holding. Doesn't mean it will go down, it could be a fake one(around 20/30 % of the times). But if it does it will test $8500, and worst case scenario $5500.
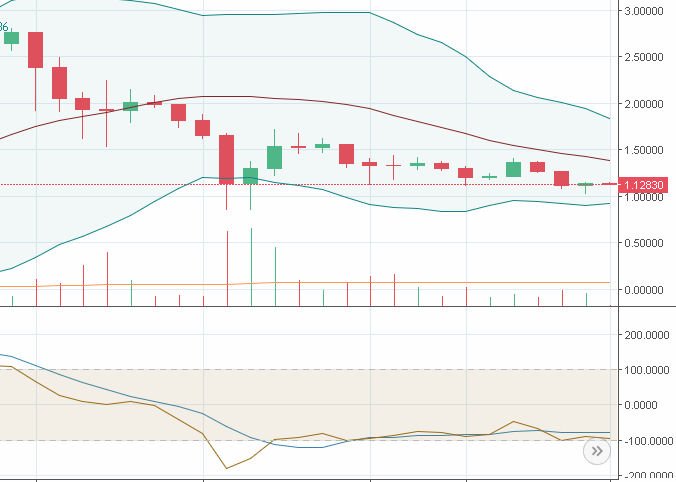
XRP
Not much movement since yesterday. I'm looking for a diferent setup entry on the daily chart. (CCI and BB's)
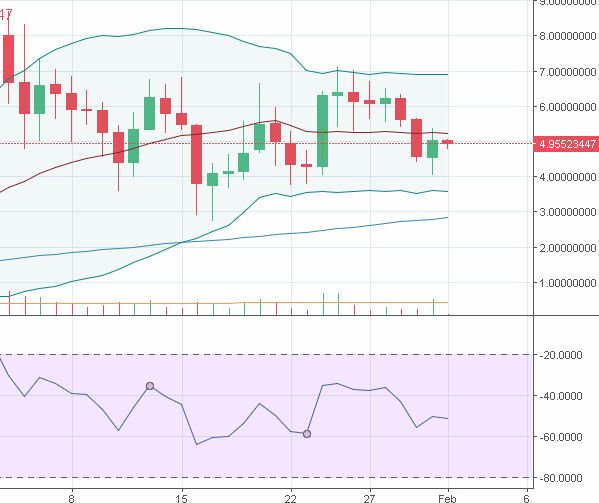
STEEM
Sell signal still holding aswell. Here on the daily chart we can see the price going sideways, the support is around the lower band $3,8. The Bollinger bands pointing sideways give me some confidence that things will change int he next days.
Interesting analysis. Check out my analysis on the 15 min chart.
If bitcoin is going to start heading higher then we need to see the bulls win the battle over the bears on the smaller timeframes first.
Here is an update on my previous analysis:
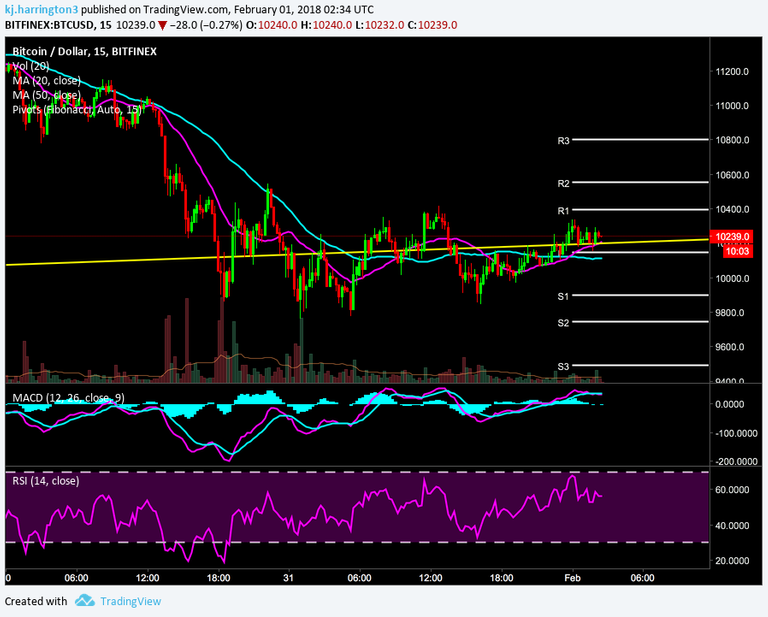
You will notice there is a new set of fibonacci pivot points that have been established. We seem to be hovering around my yellow support trend line, which was drawn from a low in November 2017. Currently, the price has come back above that trend line and is above the current pivot point. We would like to see price breach the the R1 resistance level before we can become even slightly bullish.
LEGAL DISCLAIMER
The above references an opinion and is for information purposes only. It is not intended to be investment advice. Seek a duly licensed professional for investment advice. The ideas and strategies should never be used without first assessing your own personal and financial situation, or without consulting a financial professional.