For several days the total capitalization of the cryptocurrency market is declining. Of the top ten currencies on Coinmarketcap, only Ethereum and Bitcoin Cash are currently demonstrating positive dynamics.
Bitcoin Сash
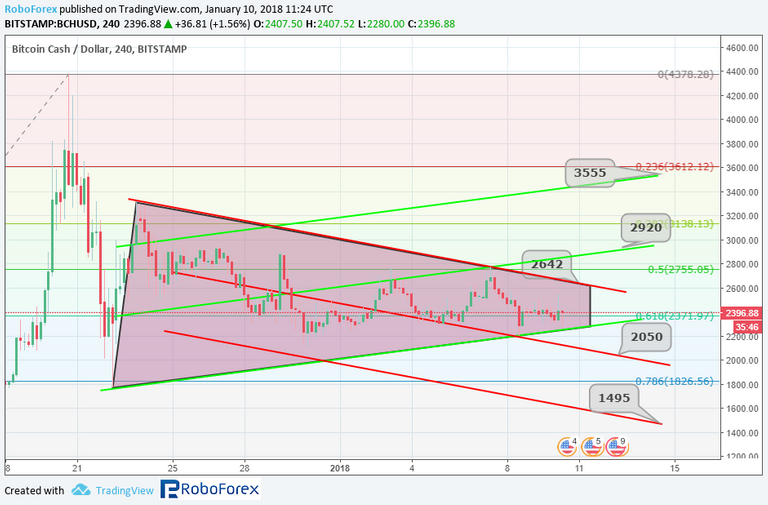
Technical picture of the situation on Bitcoin Сash shows that the previous upward trend was corrected by the subsequent downward movement by 76% on the Fibonacci scale. The current Bitcoin Cash dynamics graph shows a consolidation narrowing. This structural feature usually ends in a massive surge of purchases or sales, depending on what area the market breaks: support or resistance.
The local significant area of resistance is the zone near the mark $2642. The primary goal of growth may be the level of $2920. In turn, breakdown of $2920 level can open the way to the projection growth corridor to the level of $3555.
A signal about the development of a downward impulse may be a breakdown of $2200. The first point in stopping the downtrend development could be $2050. Having an overcome of this mark, quotations can decrease to $1495.
Ethereum
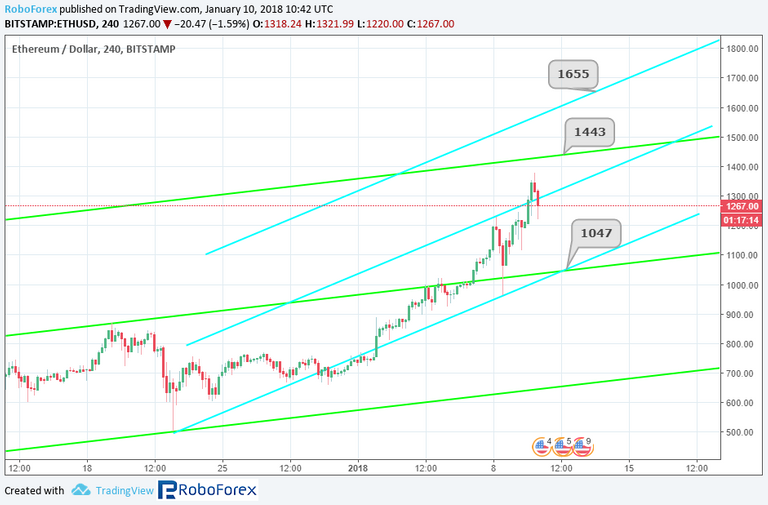
From the point of view of technical analysis, the trend of Ethereum is still ascending, moreover, the uptrend is developing with acceleration. The long-term uptrend corridor was broken in the area of the resistance line, which opened the way for quotes in the projection corridor. The main goal of this movement may be the mark of $1443.
The short-term upward trend is also developing in a similar scenario. Short-term growth momentum successfully tested the resistance line of the local channel. In this case, you can expect a corrective decline to the support line and a level of $1047. If the price is fixed above the local resistance line, growth may accelerate and reach the resistance line of the projection channel near $1655.
Litecoin
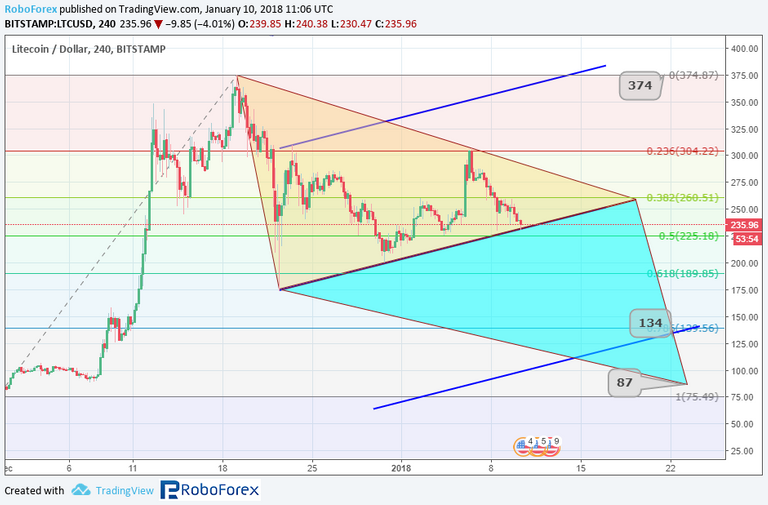
The technical picture of Litecoin demonstrates the existence of the cryptocurrency in the bearish phase of development after a steady growth. The growth range was adjusted by 61.8% according to Fibonacci.
At the moment, market tests the support line for the formed consolidation triangle for the third time. The most likely scenario for the development of the situation could be overcoming the support line and falling to $134, which corresponds to the correction level of 76% by Fibonacci.
However, we should not exclude a rebound from the support line. It can become a signal for the formation of a new bullish movement to a local significant maximum of $ 374.
Dash
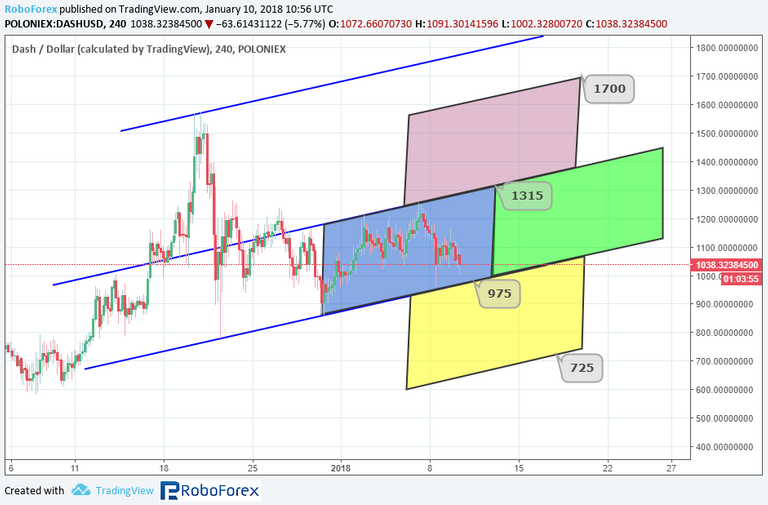
The upward trend of Dash was corrected by a downward impulse. However, in general, the price movement is going upwards.
The main scenario for the near future may be testing and overcoming the support line in the vicinity of $975. This, in turn, can drop quotes to the level of $725. But if the market continues to move in the current channel, the rebound will once again bring the quotes to the resistance level of $1315. In case of its breakdown, the way to the level of $1700 opens.
Ripple
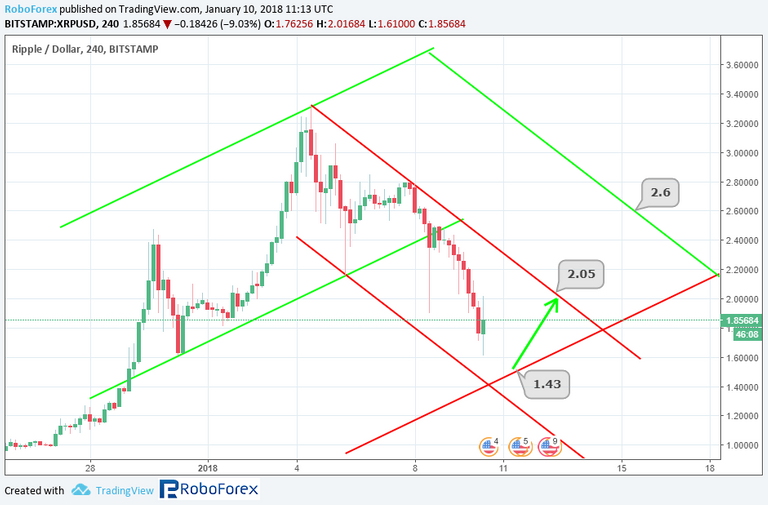
The current trend for Ripple is going down. The main objective of the current movement is the marking of the support line of the projection corridor in the region of $1.43. After working out such a scenario, one can expect an increase in quotations to the current resistance line near the level of $2.05. Break of this level will lead quotations to $2.60.
Disclaimer:
This information is only meant for use as informative or entertainment purposes.