The past couple weeks and the next couple weeks we are expecting to continue to see some turbulence in the crypto marketplace. When there is fear, there are opportunities. There are definitely major interests on the market but the big money is probably sitting on the sideline waiting for the market stabilize before jumping in. Afterall, the big money is serious money.
Timing the market never quite work
As we expecting a big price drop in the coming weeks when is going to be the perfect time to enter the market? Well, there is no way to time the bottom but there are buy signals that can indicate when is a good time to enter and exit based on market momentum, volume and etc.
What I'm going to share is the chart and technique I rely on to enter a market; don't wait for the guru and experts to give you the tips; be your own guide and learn how to read the charts.
Let's talk about buy indicators
My long term buy signal is comprised of MACD (Moving Average Convergence Divergence) and RSI (Relative Strength Indicator). Using the two together to avoid false positive and get stuck in a bull trap. These indicators are not going to help you find the absolute bottom and highs, but it will tell you when is the party started and when is the party ending.
MACD
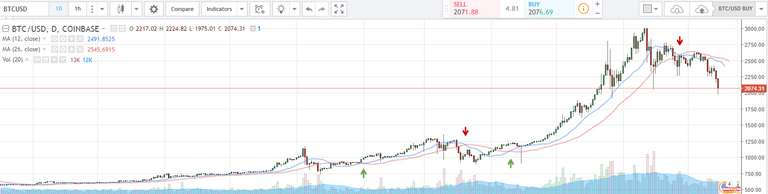
There are two lines in MACD: Slow and Fast line calculated by the exponential moving average of the long (26) and short (12) period of time.
I plot my slow line in red and fast line in blue. Magic (usually) happens when the two line crosses each other. When the blue line cross above the red line, that is considered a buy signal. When the red line cross above the blue line, that is considered a sell signal.
RSI
RSI is a momentum oscillator that measures the speed and change of price movements. RSI oscillates between zero and 100. RSI is considered overbought when above 70 and oversold when below 30. When RSI moving into either overbought and oversold, it suggests there is a retracement and rebound coming soon. I use this as a short term signal.
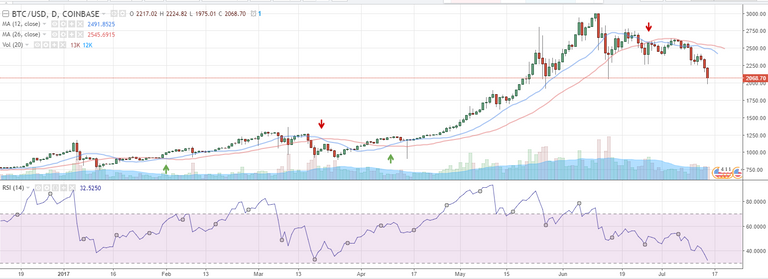
So when is a good time to buy Bitcoin again?
My guess right now based on the chart is somewhere between 1800-1900USD in the next week or two. I have setup an alarm on TradeView to send me a message when the little blue line cross over. Most of the exchange also have these sophisticated tools as well, go try them out, tweak the time range and share with me your insights.
Next up: How to find support level? That is a topic for tomorrow.

Nice information primer on basic technical analysis indicators. Lately I tend to favour Bollinger Bands and tend to use them in this way. When the bands contract into a narrow range during price consolidation, it is typically good reward-risk to purchase when price hits near or below the lower band. Typically it is a set up for a breakout to occur in the future. BB can also be used to wait out an overly heated frenzied period by forcing one to be more disciplined by waiting for price to fall back under the top band and closer to the averaged price of both bands. Worthy of investigating further.
Congratulations @qosh! You received a personal award!
You can view your badges on your Steem Board and compare to others on the Steem Ranking
Do not miss the last post from @steemitboard:
Vote for @Steemitboard as a witness to get one more award and increased upvotes!