Hello, everybody!
People in cryptocurrency talk a lot about ETC these days. Let's see if Universal-Sequential-0.101 can help
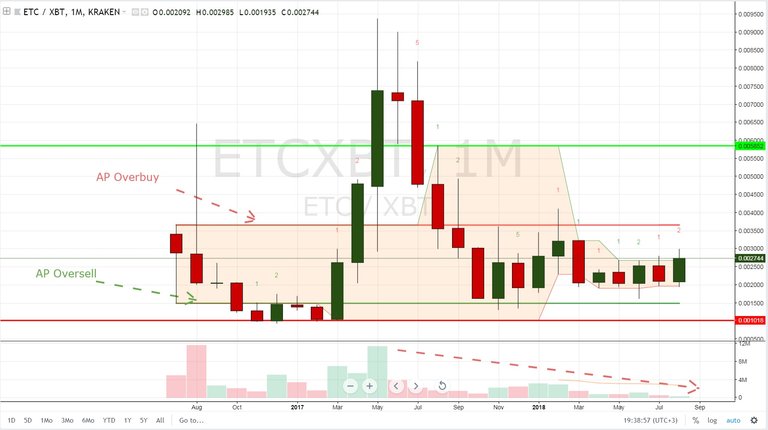
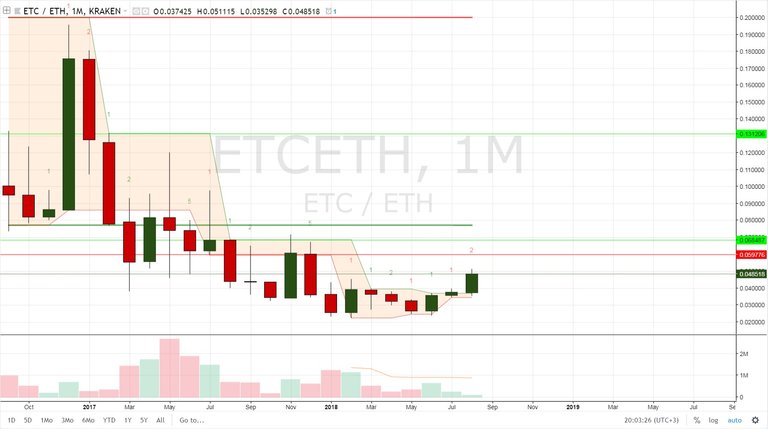
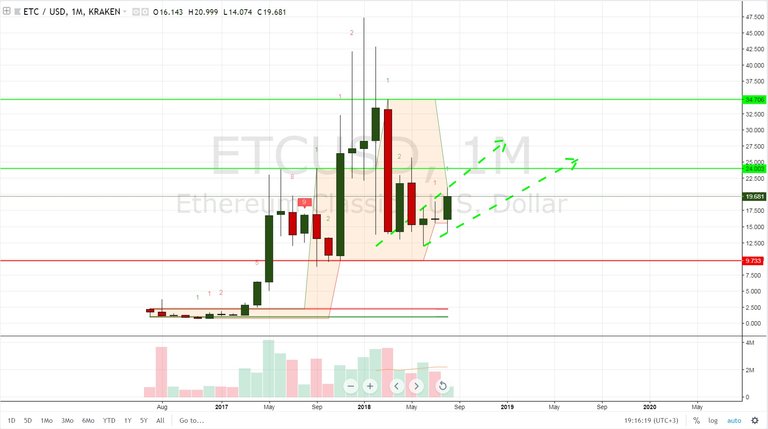 Not much to say. AP Overbuy and Oversell are sleeping... Candles looks bullish though.
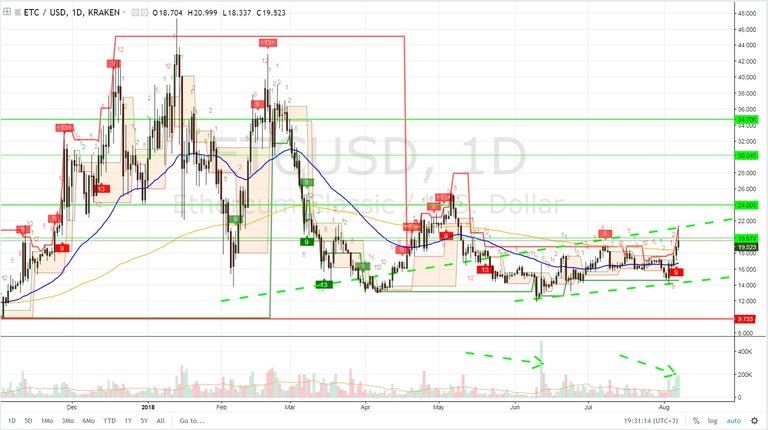
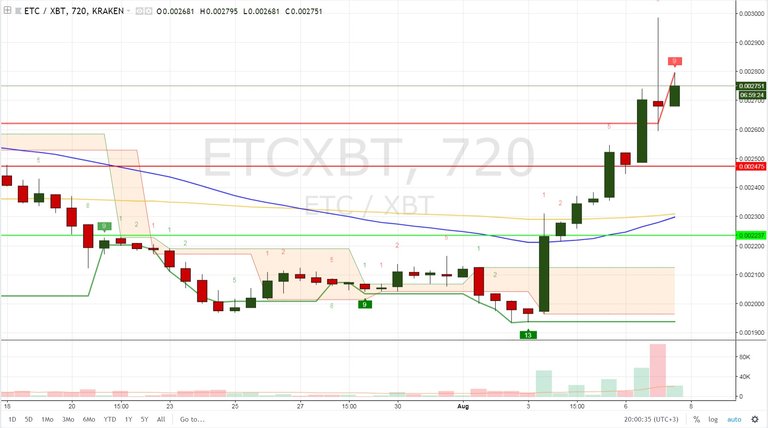
 If you look at the previous candle, you'll see a green 1 above it, but right after we have a green bullish candle. So can we say in this case that we had a mistake of a script trying to identify AP Setup? And the answer is YES! Well, the problem right now is a Pine script functionality, not much more to say about this subject.. (I hope, I wait... I pray in the nights that someday Pine script will have enough flexibility to handle this sort of an exception). Accordingly to our candles, we should most likely see a red 7 above the current candle, which opens an opportunity for red AP Setup and maybe even Countdown — again, very happy.
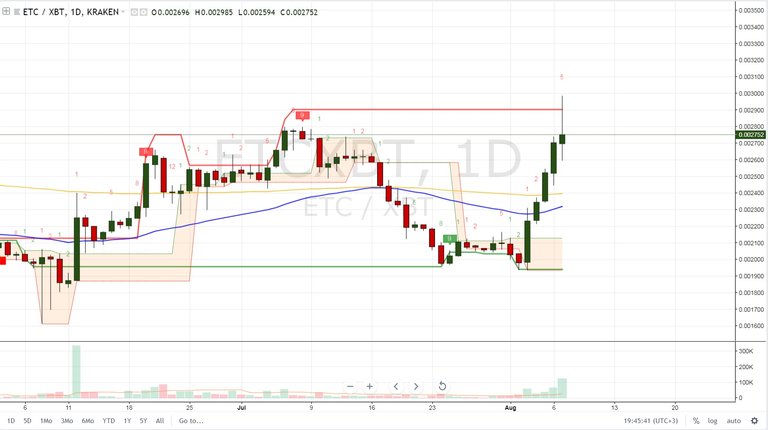
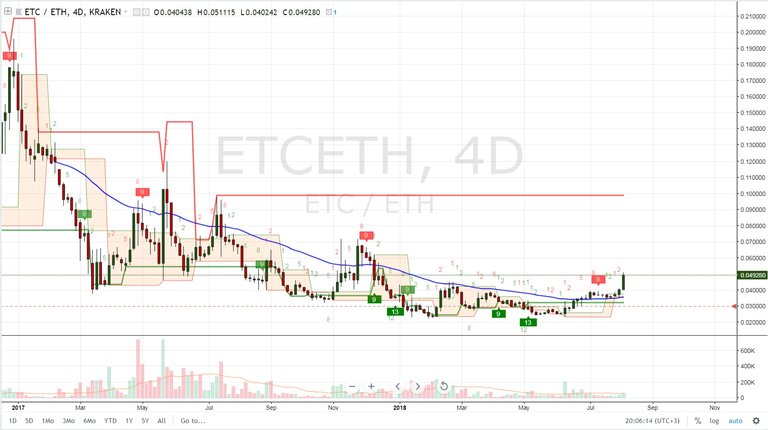
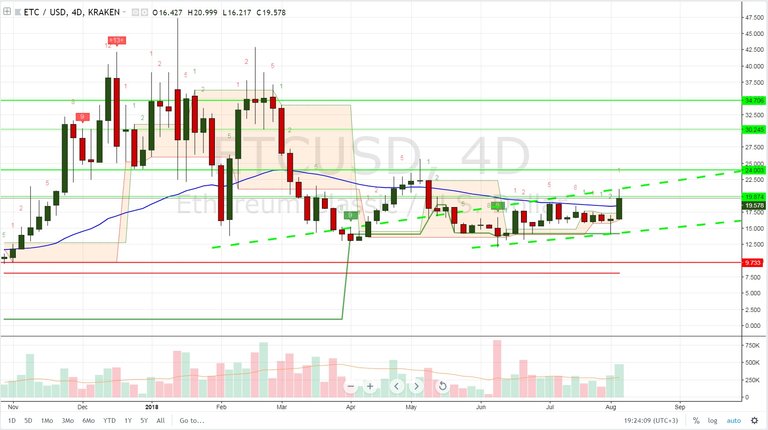 Price is above AP Overbuy and Oversell + we have a breakout of AP Oversell on green 9 that broke through AP Overbuy followed by another green 9. After that, the price failed to close AP Setup to start AP Countdown. Right now, trying to break through resistance of the previous setup’s highest high. Most likely scenario, as I see it, is a breakout to $24 resistance if we can stay above the highest high of the previous Setup.
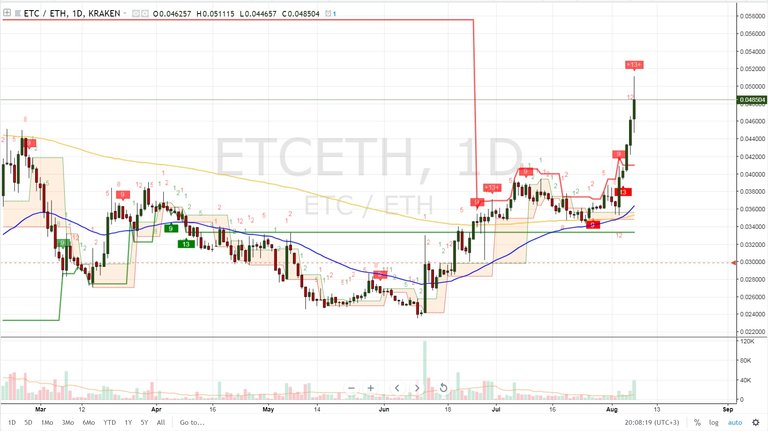
 Price moving up, taking AP Overbuy higher, while Oversell is sleeping. We are now on a red 4 of AP Sell Setup with potential to move higher to a red 9, and if, this time, we can start a Countdown, then maybe we will talk again about a $34 price in late August - mid September
Now what about ETC/BTC?
 ETC/BTC bullish when red 2 closed above the previous red 1, but since then been quiet. First serious resistance is at .005852.
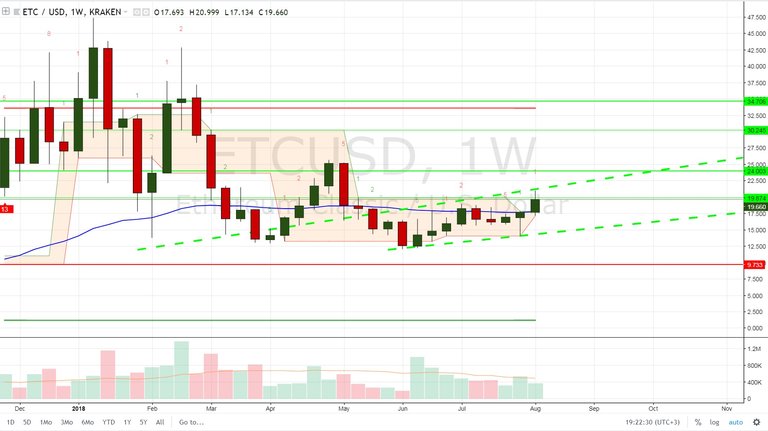
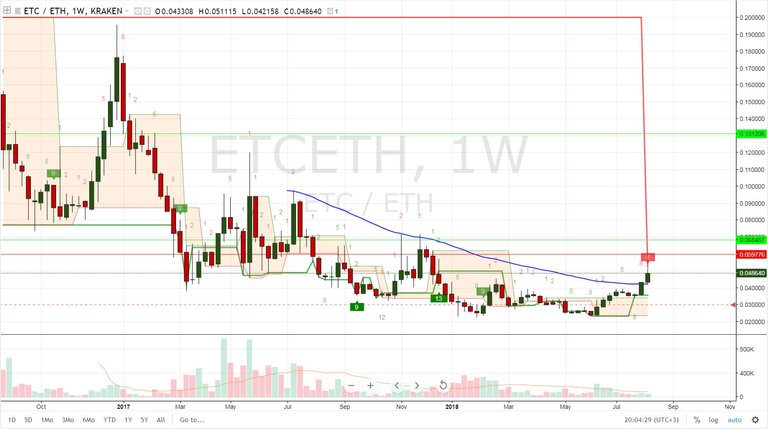
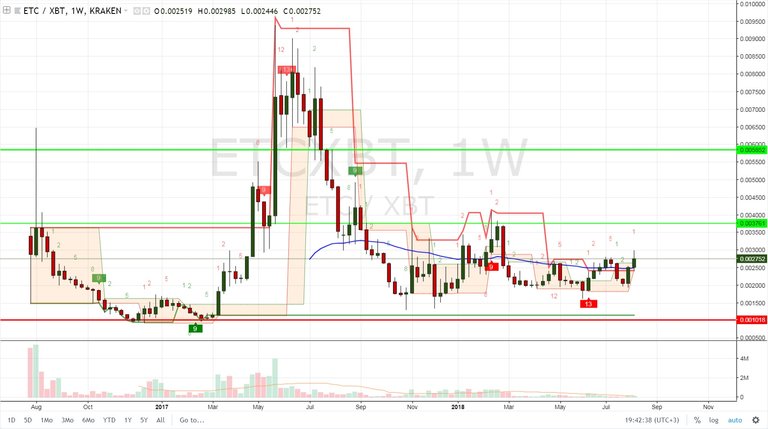 Weekly price most likely going to close above the AP Overbuy. Resistance/Support levels are on the chart, as always.
 4 day timeframe is bullish! Red 2 above the red 1 - we have potential for AP Setup and maybe Countdown, just maybe ;-) For now, the price will try to break through resistance of the previous setup’s highest high - same as ETC/USD 4D.
 Red 5 brroke through AP Overbuy, which opens the road to potential for a short-term correction.
 Looks like we have potential to close AP Setup, which is perfect to start AP Countdown. Let's see if the price can make it.
And what about Ethereum?
 + Red 2 above red 1 - bullish.
- Price under AP Overbuy and Oversell
 + Strong Red AP Setup - good start for AP Countdown.
- AP Overbuy jumped into the red 9, so let’s not forget to respect the power of resistance that it's going to show.
 + Red 2 above red 1 - bullish for AP Setup.
Looks like the price found a proper place for AP Oversell and now wants to test AP Overbuy with strong resistance on the way around .075 - which is suddenly the first green 9 in a downtrend. What indicator shows you this kind of things? Pls, comment below, I’m super curious!
 Red +13+ AP Combo: maybe it's time to think about a short-term correction.
Conclusion:
Bullish on ETC — if it can turn resistance into support — with a possibility for $24 in August and up to $34 in September. But keep an eye out for a potential short-term correction (or failure to close above the line of previous red 9 Setup).