Bitcoin Hasn't Done This Since 2015 Before Its 10,000% Bull Run

https://cointelegraph.com/news/bitcoin-hasnt-done-this-since-2015-before-its-10-000-bull-run/amp
MACD monthly analysis
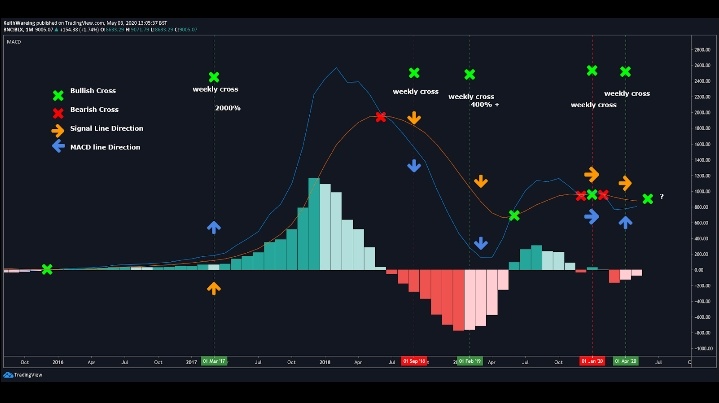
BTC USD monthly MACD chart Source: TradingView
Last week, I highlighted the significance that the moving average divergence convergence (MACD) Indicator has on the price of Bitcoin when it crosses bullishly on the weekly timeframe.
However, with the bullish monthly candle close comes a new picture for the monthly MACD. Mapped out above is the monthly MACD bullish and bearish crosses with the weekly MACD bullish crosses highlighted with the dotted lines — green for bullish crosses that saw a big run after, and red dotted lines for the false bullish crosses.
The reason for this map is to see if there are patterns that match with the 2017 weekly bullish cross that saw a 2,000% rise. But it’s also useful to see if the higher time frame view is showing us any contradictory momentum that could suggest a dump is due soon.
Moving from the left to the right of the chart, what this shows is that back in March 2017 when the weekly MACD crossed bullish, the monthly MACD was already in a bullish crossover from 2015.
Thus, at the point of the weekly bullish crossover, both the MACD and signal lines were on an upward trajectory. This resulted in a 2,000% increase in price for Bitcoin from the point of the weekly cross.
Later on, the false bullish crossover on the weekly in September 2018 shows us that the monthly MACD and signal line were both in a downward trajectory and that the monthly MACD was already crossing bearishly. Thus, the higher timeframe momentum was signaling that the move from weekly MACD crossover may not be valid.
The February weekly bullish crossover seemingly has exactly the same conditions as the September crossover with one difference. The histogram on the monthly MACD was losing downward momentum as can be seen by the paler pink color compared to the darker pink in the previous crossover. In this case, it resulted in a 400% increase in the price of Bitcoin.
But if you’ve read this far, and you’re still following where I am going with this, the monthly signal line is on an upward path for the first time since October 2015, back when Bitcoin was just $200 per coin, and if you take this to the $20K all-time high, that’s a monstrous 10,000% or 100x move.
So with this in mind, will the next bullish cross on the monthly MACD happen in June? Are we in store for a 10,000% increase from the current price? Only time will tell.
Source
Plagiarism is the copying & pasting of others work without giving credit to the original author or artist. Plagiarized posts are considered fraud and violate the intellectual property rights of the original creator.
Fraud is discouraged by the community and may result in the account being Blacklisted.
If you believe this comment is in error, please contact us in #appeals in Discord.
Hi! I am a robot. I just upvoted you! I found similar content that readers might be interested in:
https://onlycryptodaily.com/358-2/