It was a useful gauge with Bitcoin and turns out for the U.S. stock market as well!
What exactly are we talking about? Well, it's something I've mentioned in the past...
The 200 Day Moving Average

See that blue squiggley line that bitcoin price got crazy far away from and crashed back down to this week?
That my friends is the 200 day moving average, which in the end is just represents the average price of bitcoin over the past 200 days.
Why and When I Use It
It's a longer term average that is widely used throughout the investing world, and to me is an example of slow orderly movement.
When price runs too far away from it - more often that not we see price converge back to it. Pretty basic and simple stuff here.
Thus when Bitcoin was 4, 5 times the distance from the 200 MA compared to the past year.....I got a little skittish and was definitely not adding to bitcoin, but rather trimming on up moves and buying back on down moves.
Now Let's Look at What Happened to the S&P 500
Anyone who has even seen a clip of news this week know the U.S. stock market got hit hard. I said a week ago (on the music and money radio show) that the S&P 500 had gotten ridiculous in January.
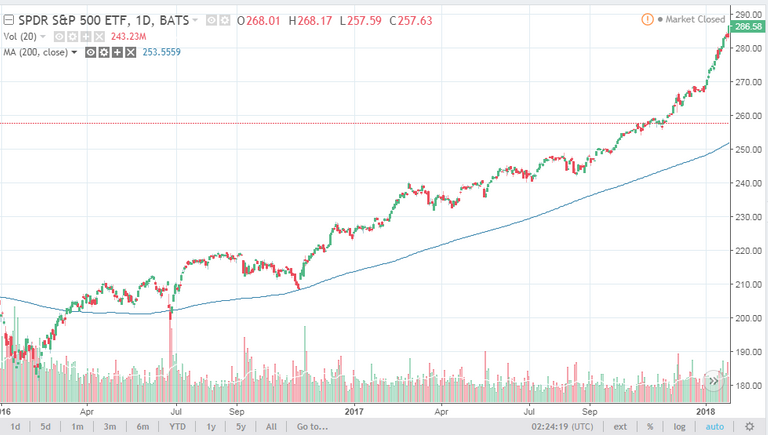
The index had been well above it's 200 MA for some time, but now it stretched much further away in a short time span.
A convergence was bound to happen, but when never know when that will occur. Could be a few day, weeks, or even months.

And so we have received it. Will the S&P get down to the 200MA, who knows. But it converged a majority of the spread on this violent down move - that is for sure.
Conclusion
As you can see this principle transcends markets. Cryptos, stock, commodities - the information applies.
When a market is extremely extended from it's 200 day MA, I am not looking to aggressively enter positions. Staying nimble at those times is prudent.
Could I miss out on some returns as the over extension continues? Sure - but I will also not be the one who gives most of it back when we see these draw downs.

Wanna Learn How to Read Crypto Charts and Invest Like The Cat?
These Videos Teach You The Three Simple Things I Use:
https://tradingeducationblogs.com/scg-crypto-investing/
Need to learn the basics about bitcoin, the blockchain and wallets?
Free e-book: ScaredyCatGuide to Knowing What the Heck Bitcoin Is

Best Regards,

Disclaimer: All info in this post is my opinion and for educational use.
Free e-book: ScaredyCatGuide to Knowing What the Heck Bitcoin Is
Best Regards,
Disclaimer: All info in this post is my opinion and for educational use.
Got to look through these graphs and the videos.
Keep on steemin'
Fantastic article! I've followed and up-voted your post i look forward to your future content!
For info and technical and fundamental analysis of Crypto's, an insight into how the whales manipulate the market and how to get involved in an exciting 12 month millionaire challenge we've recently started, check out @cryptobroye :)
Great analysis! The economists of our time
Nice to see it laid out in a clear graph. Like so many economic events, people look at the crash as though it is the problem, and turn a blind eye to the bubble that preceded it. There are massive profits to be made in a bubble if your timing is right, but it's hard to know exactly when it will burst, too, leaving you high and try. This analysis at least help offer an approximation of where it is likely to trend toward when it does burst.
Yep, in the end it's just a gauge. As the saying goes "the market can stay irrational longer than you can stay solvent."
I've been following your page for a while now, and I have to say you are one of the most informative individuals here when it comes to technical analysis. Thank you for the information!
Thanks! Glad you are finding value in the posts.
Thanks!!!! I'm glad that you are finding a great value in the posts.
I´m adding the EMA200 to all my analysis from now on, I think the point you just presented makes a lot of sense, and in a lot of markets that I tested this "rule" always verifies itself.
Yep, it's good to use as a gauge.
Always on spot with your crypto analysis buddy, thanks for your analysis
That's a good way to use it! In my checkered experience, it's better to use TA as cautionaries instead of crystal balls.
That's right! It's all about putting probabilities in our favor. Not picking exact tops and bottoms.
Is this also true for the 100 day and 50 day? I have been introduced to these concepts from datadash but I haven’t fully understood them yet.
In the end, one could use any period moving average they like. I know people that use 20 day even for day trading. I've found with crypto the less "noise" I have the better my results.
Your best bet is to just look at the 100 day and see if it comes into play or not. The 200 day as a broad gauge I know is useful as I've used it for many years against all different types of investments.