http://www.cryptotradingmastery.com/
*** please RESTEEM and VOTEUP if you like this post ***

PLEASE WATCH VIDEO BELOW: Episode #1 Bitcoin BullTrap - Buyers Beware
At first glance, Bitcoin on a 4 hour chart has a breakout to the upside of a triangle (pennant) indicating a bullish move for buyers, as the buying frenzy resumes.
But wait a minute... let's take a closer look..
To have a larger view of the chart, just right click on the chart image and select "View Image"
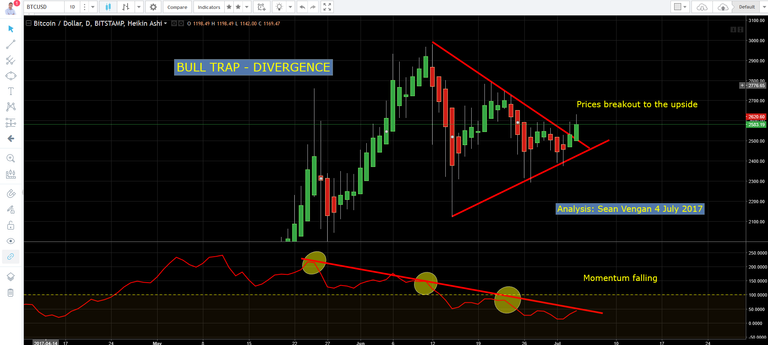
We see this same price action on the Daily chart (higher timeframe) which is telling us a differnt story.
Here it shows that while price is currently rising, look at the momentum is it going up or down? The highs of momentum is falling, right.
Prices rising and momentum falling signifies something is not right this is known as DIVERGENCE and is a RED FLAG!
To have a larger view of the chart, just right click on the chart image and select "View Image"
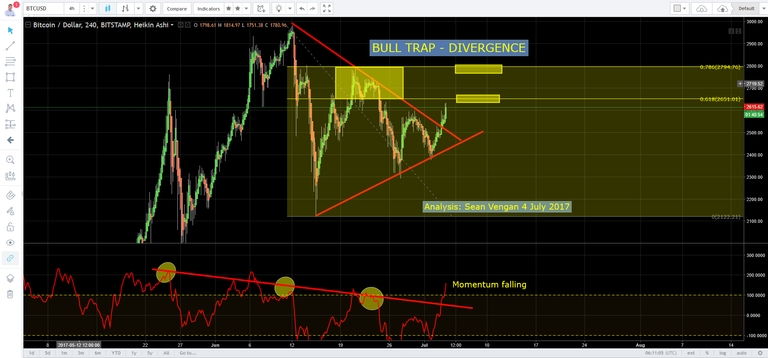
A closer examiniation of the Fibonacci levels reveals that we have 2 levels of resistance buyers need to successfully overcome (marked with the yellow boxes). The first is at US$2,651 and the second at US$2,794.
As we look left on the price action chart, we see that in the past this "price zone" has been an area of tussle between the buyers and sellers, with the sellers exercising their muscle. As we are still in a down trend the safest trade is WITH the Trend not against it.
Hope this helps.
Analysis by Sean Vengan 4 July 2017
If you like this post feel free to "Resteem"this post , "Voteup" and follow me at "https://steemit.com/@supertrader"
Website : http://cryptotradingmastery.com/
YouTube: https://www.youtube.com/playlist?list=PLn7YikUv2BchBGW8Gza0o6uOPAb3Sop9Z