
Bitcoin recovering from the last deep lows and regaining ground consolidating it's price. Price is still moving in bearish trading channel but possible breakout is on the radar in the next few days.
Tectonic moves on all markets have marked the beginning of the new year 2018. In past two weeks stock markets almost nosedived. In the past days pullback had happened, but concerns of bigger market correction is not put off the table. Mainstream media start a campaign to support economy, but as always, economy is not driven by news as many people blindly accept, because they are indoctrinated by media bombardment.
At the same time interest rates of US treasury bonds had raised on future markets indicating potential inflation of US dollar. Again news machine try to convince public opinion to believe that this is actually good for the economy and a little inflation just bust economy even more, but a stage for dangerous spiral inflationary movements is set and more FED interest rates hikes will inevitably trigger treasury bonds interest rates soar which in turn trigger more FED hikes. Prices of goods and services will soar and Venezuelan scenario will unfold on the American soil.
The chart patterns are rock solid and denying news machine claims. Bearish trend is drawn on Dow Jones index chart.
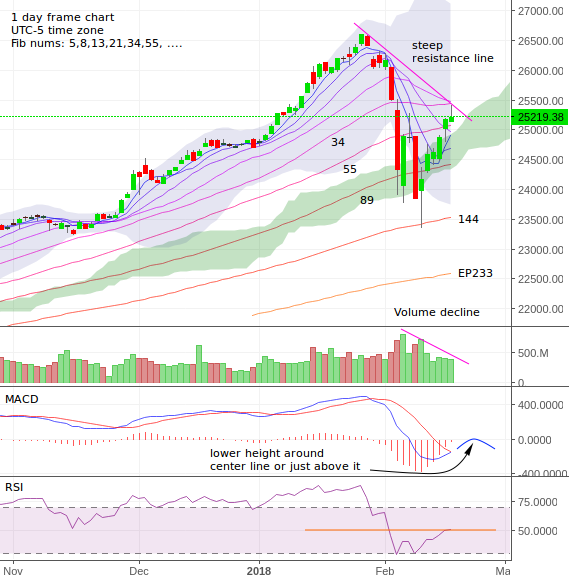
Very steep resistance line had formed on the Dow Jones index chart. A volume decline support bearish movement of index. Also MACD indicator blue line will probably form a lower height around center line or just above it, which is definitively lower then the previous height and RSI indicator will not ride much above 50 level. A shooting star candle had formed for the last day of trading and this is a strong bearish candle pattern. If it will be confirmed with lower red candle we will see some downwards movement of index again. Rapid breaking of price through EP lines is definitively not a good sign also. News try to produce hopes for resuming uptrend but chart is relentless and points down.
Almost simultaneity Bitcoin had reached his lowest point at just below $6000. Since this moment a pullback to the upper significant resistance line made from two last heights will be tested sun. This uptrend continuation implies movement of money from hot stocks, ETF's and similar financial instruments to more safe assets and for many traders, Bitcoin and other cryptos is seen as a safe haven beside gold and bonds.
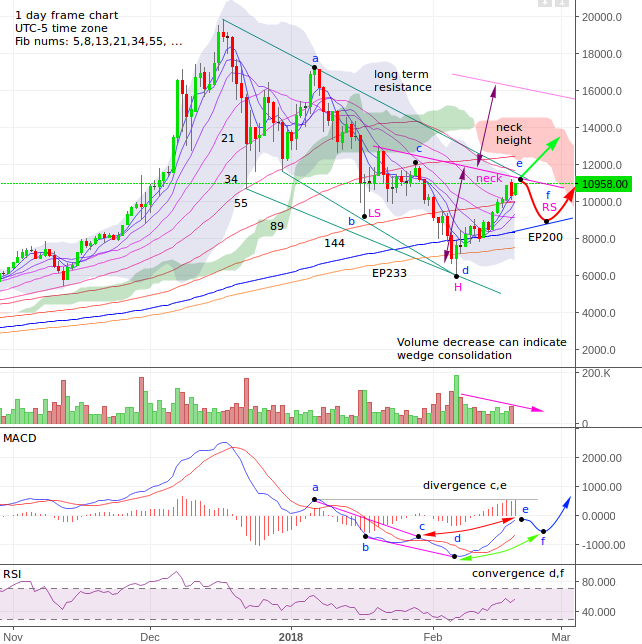
Resistance line from all times height in December is testing. We are now in important turning point where two possible scenarios are at stake. First possibility is breakout and immediate continuation of uptrend and the second one is bouncing from the resistance line and continuation downwards.
If second scenario will unfold a inverted head and shoulders pattern formation is possible. In obvious downtrend confirmed with convergences between price and MACD indicator in points a,c and b,d a divergence in points c,e will be confirmed if price bounces from resistance line. Next possible low can be expected by touching EP200 (MA200) line. This will create positive convergence d,f and set a footstep for uptrend start. Inverted head and shoulder pattern will be completed and this pattern is strong trend reversal indicator. Volume decrease can indicate wedge consolidation.
Our portfolio on BitShares recovering and is extended with bitGOLD position. Yes, you can trade gold on BitShares.
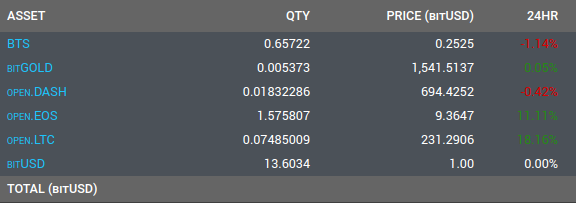
After selling BTC our original investment ($45) is now worth $43.64. We are short for $1.36 which is 3% loss. I also added EOS and our portfolio is now worth $66.84. We will not trade at the moment. With BTC we will wait for unfolding of inverted head and shoulder pattern and start laddering in after bounce in point f stand firm.
Don't forget to check out this new TFDSRE thing Elliott waves are not the only thing, you can surf on: #1, #2, #3, #4.
Previous analysis: #26, #27,#28, #29, #30, #31, #32. Is good to check them out to get insight into my reasoning.
Image sources: investing.com, google.com
Data sources: Bitfinex exchange
Disclaimer: If you use my ideas and analyses in your investment ventures, you take all responsibility and consequences about your actions.
What do you think about BTC price? Comment and present your views! Great ideas emerge from good quality discussion! I'll be immensely grateful for your contribution.
Check also technical analyses from TAF squad: @pawsdog, @futuristgear, @exxodus, @allthereisislove, @lordoftruth, @ew-and-patterns, @toofasteddie, @gazur.
And as always upvote this post and previous ones, if it have some value, follow me, if you think this content is great and I promise that it will be more interesting stuff in the future. Let steem on, to the bright future!
I'm sorry i missed the chance to upvote.I hope you will post again and i will check. feel free to drop me a note if u don't see me interact at all on ur next ta
Absolutely! I plan to write one today because some important turning point occurred! I drop you another replay on this present comment.