Monero (XMR / USD) is a very good example of how well charting can work if used correctly. No complicated mathematical formulas. Simply the power and market relationship between resistance and support or buyers and sellers. Monero, like many other crypto currencies, is currently struggling with a severe correction. Therefore, most charts look identical. The clock is of course the bitcoin.
Looking at the XMR chart, the technical analyst notes that the large support in the range of $160.00 could not be sustained.
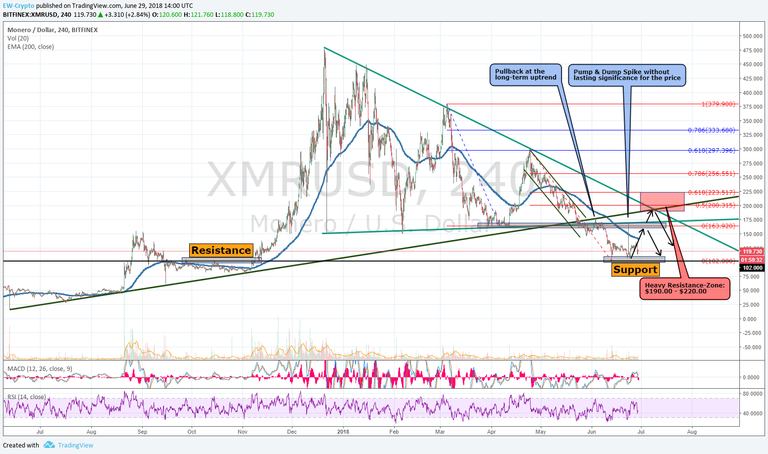
Interestingly, after leaving the long-term uptrend, there was a typical pullback reaction of the price from the bottom to the trend. A final opportunity for buyers to exit their trading positions before the downward movement gained momentum and accelerated.
Even the "pump & dump spike" on June 23 could not change the situation. However, this bounced off exactly from the former large support region at $160.00.
A first tentative soil in the range of 100.00 $ was formed. This is not unusual if you look further to the left of the picture at the former resistance zone, which could now possibly serve as support from the opposite side.
Should XMR / USD succeed in creating a stable ground, however, there will be very great resistance on the way up. The resistors are in the $145.00, $160.00 range. Finally, the large resistance zone in the range $190.00 - $220.00
This is NOT investment advice and does not require buying or selling. Every reader is aware of this and makes their own investment decision with their own understanding of risk management!
Cheers Jessy