**Hello how are you
I am sorry for yesterday
This is the chart of Tron/USD
**1.Trx/Usd
**So now we will see down fall after touching the level $.0408 Fib 23.6% it is currently at $0.039 well we see the upgain i start at the level $0.038 level it is not more precisely because it is still under the level of sma 200 and sma 50 which is indicates that it is downfall **
2.Xlm/Usd
This is the chart of XLM/USD


**Now After touching the level of $.218 of it start s back now its touch the 100% Fib level so there is upside gain is possible in some hour from at the $.209 if this break it the level there is strong support at 161.8% at price level $0.19 it is still rose the 100 Sma **
3.USDT/USD
This is the chart of Stellar
Usdt is currently at the level of $.999 so now ahts is touched the $1 level but it is not stay at the level and comeback But all Sma is likely indicates it should go and stay the level of $ 1 in near future so enjoy your tarade

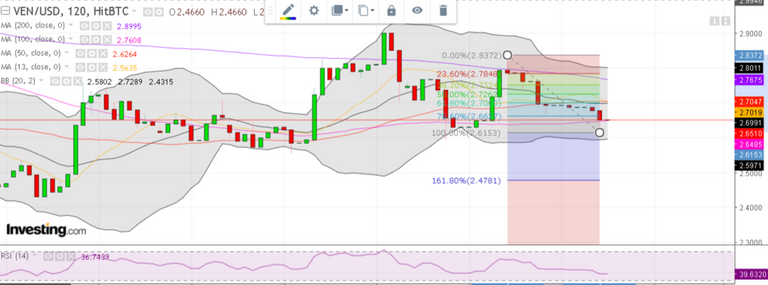
4VEN/USD
As you can see it is backed after touching the level $2.83 and currently at $2.69 almost $2.70 it is up over 100 day sma but it is under 200 day sma 50 day breakout is likely possible of upside
Note - this is only for educational purpose.risk is yours. money is your decisions is yours.
bye bye