
Bitcoin's drop over the last 24 hours was not as all surprising. If you've been following my updates, I pointed out the bearish rising wedge, and explained how a temporary drop was likely. Both my bullish and bearish counts called for the drop...the question is, which scenario are we in?
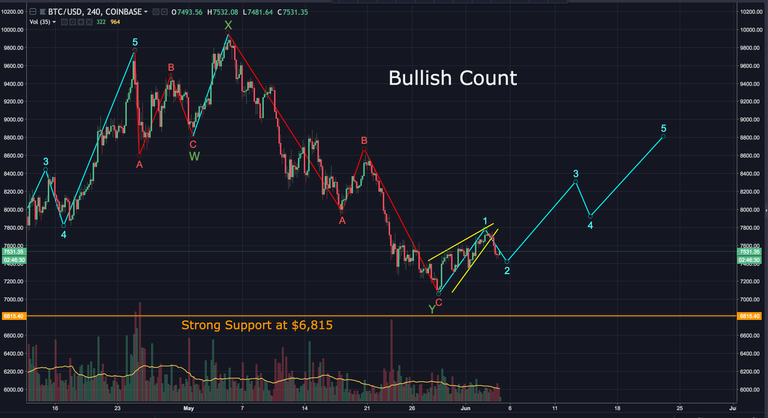
My bullish count has bitcoin in wave 2, of 5 waves up.
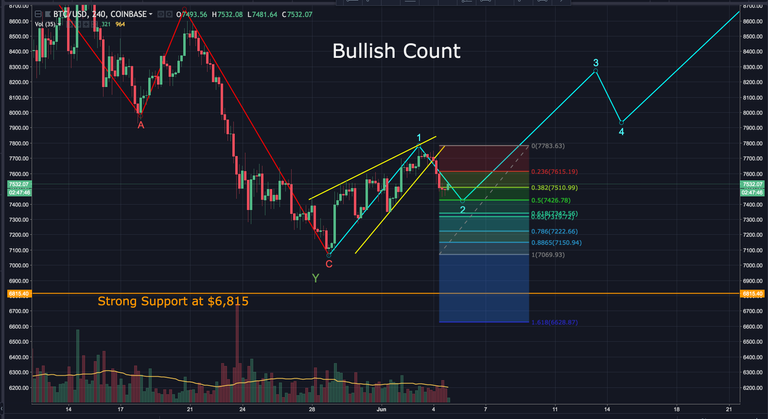
Wave 2 is looking for a bottom. Zooming in, you can see bitcoin briefly penetrated the 0.382 fib level. I believe there's a good chance it'll drop to the 0.5 fib before a bounce. Here's how it may play out:
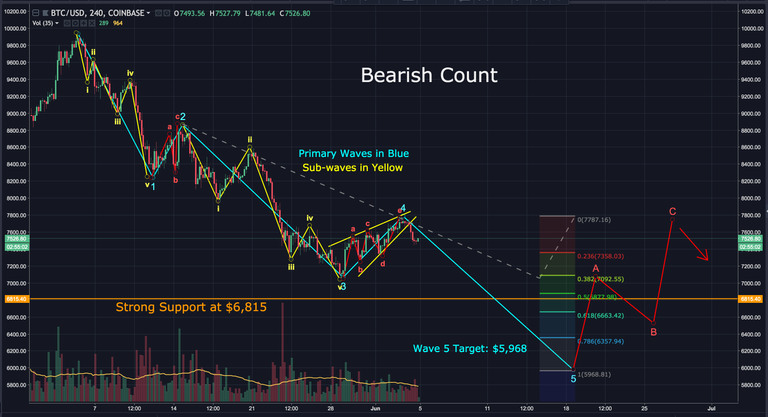
The bearish count has bitcoin in 5 waves down. If accurate, this latest drop was the start of the 5th wave. The target for wave 5 is approximately $5,968. Here's how it may unfold:
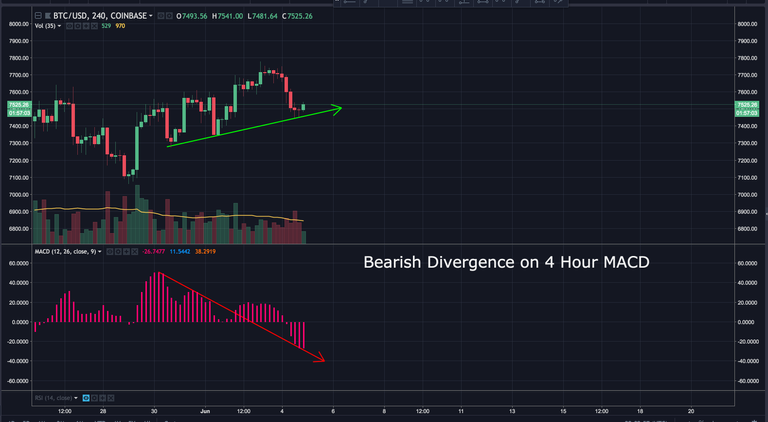
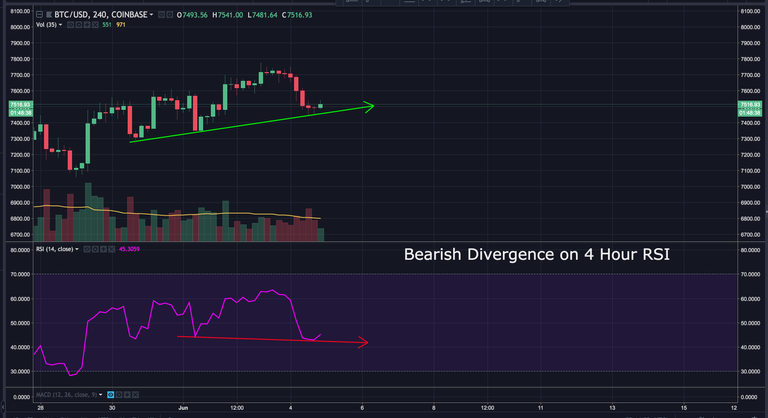
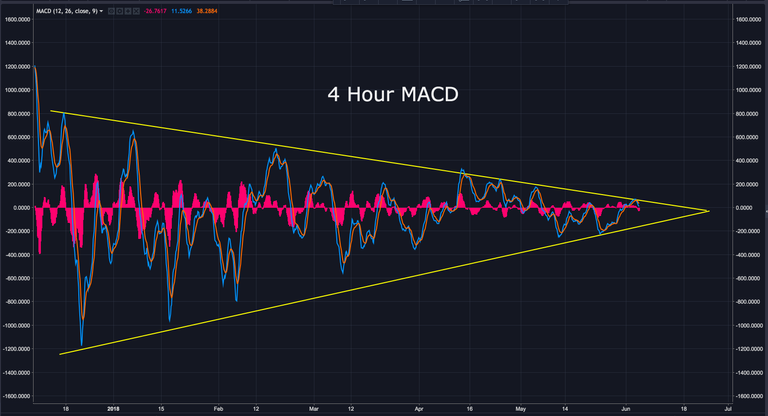
The 4 hour MACD and RSI, are both showing bearish divergence. This may indicate a further drop is coming.
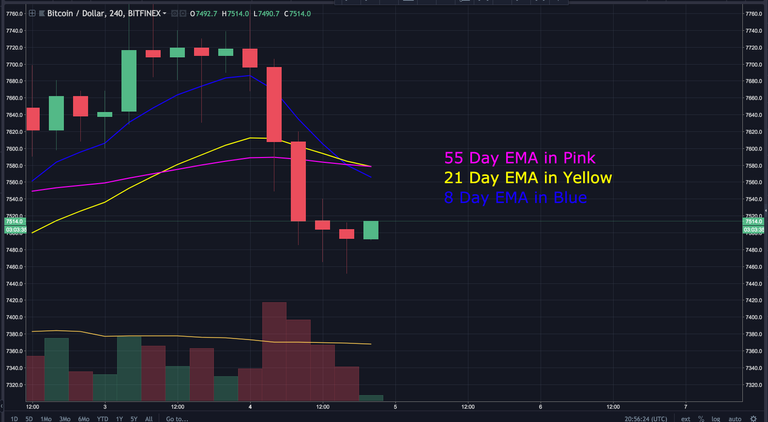
The 4 hour chart shows the 8 day EMA has crossed below the 21 and 55 day EMA...an indication of a weakening market.
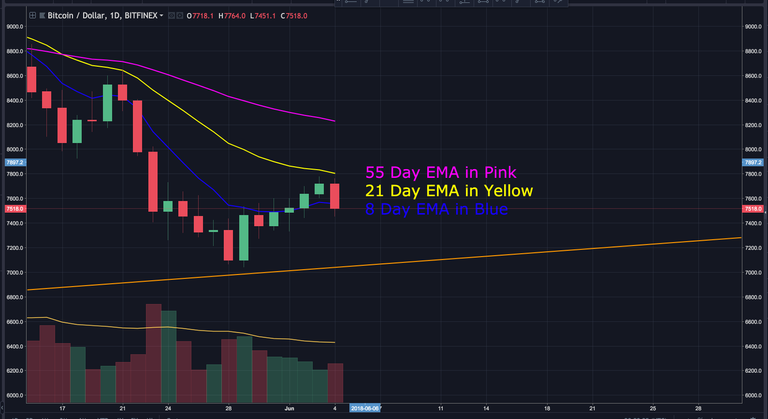
On the daily chart, a bull market will have the 8 day EMA on top, the 21 day EMA in the middle and the 55 day EMA on the bottom. The 1 day chart is currently showing the 8 day on the bottom, 21 in the middle and 55 day EMA on top. They're also extremely fanned out from each other. This is rather bearish, and shows bitcoin has a long way to go before it's in a true bull market.
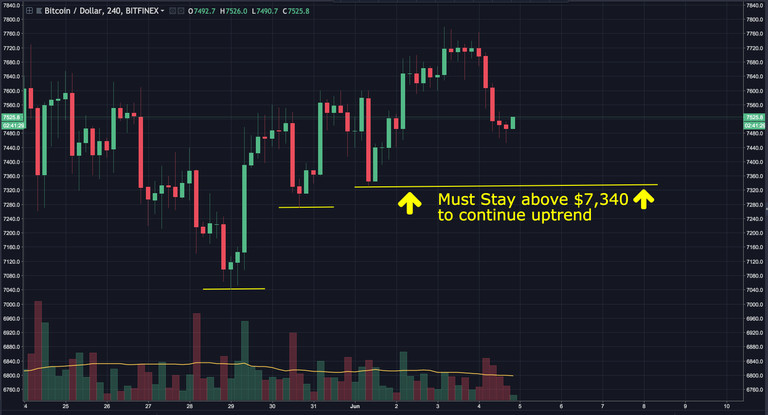
In order to continue the slow uptrend we've seen over the past few days, bitcoin must remain above $7,340. Dropping below would be another indication of a weakening market, and lend credibility to my bearish count.
Continue keeping an eye on the wedge that's developed on the 4 hour MACD. As it approaches the apex, a major move up or down may occur.
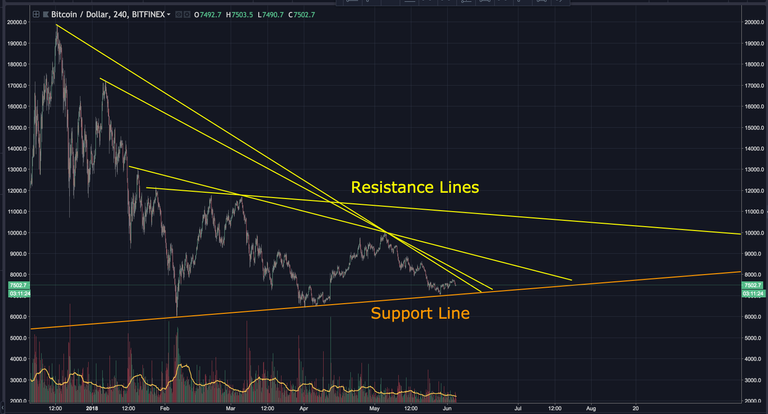
A few days ago, I pointed out 4 major areas of resistance bitcoin needs to break through. It's approaching the first. There's also a strong ascending support line making this slow uptrend possible. One of these is going to break in the next few days...maybe a week at most. If the support fails, the next area of strong support is at $6,815.
Unless you're a skilled day trader, I'd sit on the sidelines with a wait and see attitude. Don't let FOMO cause you to make a poor decision. There will be plenty of opportunity in the future. If you do decide to enter a trade, consider keeping your stop-loss tight. As always, this is just my opinion, not financial advice.
The next 3-7 days should be interesting. Let's see how it play out.
BIAS:
Short Term: Neutral
Longterm: Very Bullish
I hope this has been helpful. I’d be happy to answer any questions in the comment section below. Thanks for stopping by.
If you found this post informative, please:

Disclaimer: I am NOT a financial advisor and this is NOT financial advice. Please always do your own research and invest responsibly. Technical analysis is simply a guide. It doesn’t predict the future. Anyone that claims they know exactly what’s going to happen is foolish, lying or both. Technical Analysis should only be used as a tool to help make better decisions. If you enter a trade, I recommend having a stop loss and sticking to it. You will loose at times. The key is to have more wins than losses. With that in mind, I wish you great success.
If you don’t have an account on Binance, I STRONGLY recommend getting one. They’re usually the first to get reputable coins, have excellent security and second to none customer service. You can sign up here free of charge: https://www.binance.com/?ref=16878853
**FYI…I just started a Facebook and twitter page where I’ll post analysis, along with other relevant crypto data from myself and others. If you’d like to be notified as soon as updates reach Steemit, the twitter handle is @Workin2005 and the Facebook page is https://www.facebook.com/The-Cryptocurrency-Revolution-587441898287918
![]()
A recovery. I had to post it, based on the title. If it does swing below 6k I guess we will see some real action.
Should be an interesting week.
Imstrongly believe it stay at the trend of 7.3k above as it is currently trying to break a v trend. My view but it may not be true also. Recently found it interestimg to play with the up and down trend . But i just predict from others prediction.
Thanks for stopping by @steemfuture
What's with the bearish divergence ahead of this morning's rally? Very hard to predict, this is random behavior on steroids. Now what?
I was a little late noticing the bearish divergence. Still, it did drop another $140 to $7,370 before it started rallying. I'm going to try to post an update soon.