Hello Hivers!!
First of all, I want to point out that the following post is NOT financial advice or any kind of recomandation, nor am I lisenced to give one!
It is my personal opinion and view on the chart!
Today I'm charting the DASH Binance chart, looking for some short to medium term targets on the upside.
For start let's look at the clean weekly chart before diving down to the daily to do some TA.
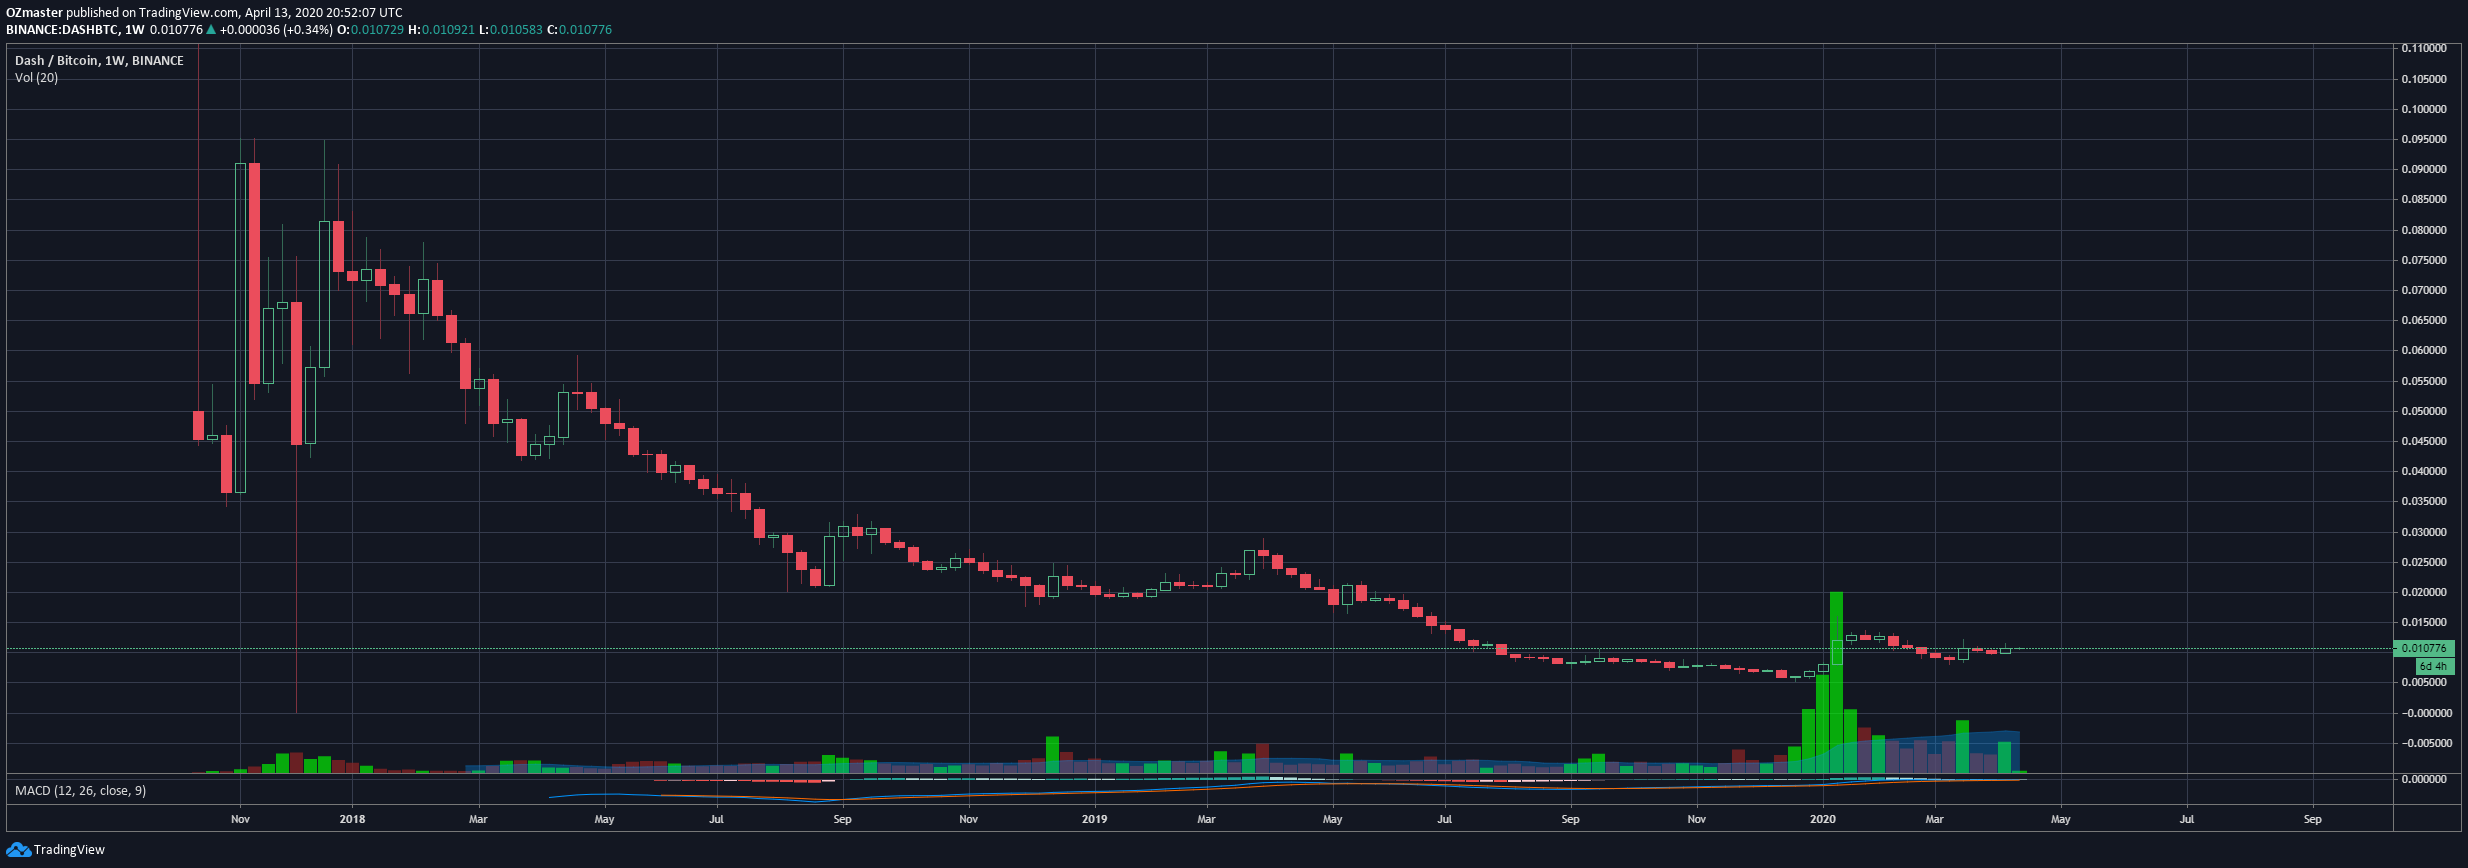
https://www.tradingview.com/x/GVqxpA11/
We can see that since listing on Binance, althou it had some pretty sharp pumps from ~0.03btc to ~0.09btc, DASH has been in a steady downtrend.
Taking a look at the daily chart ti get a better view on whare possible resistance support areas might be.
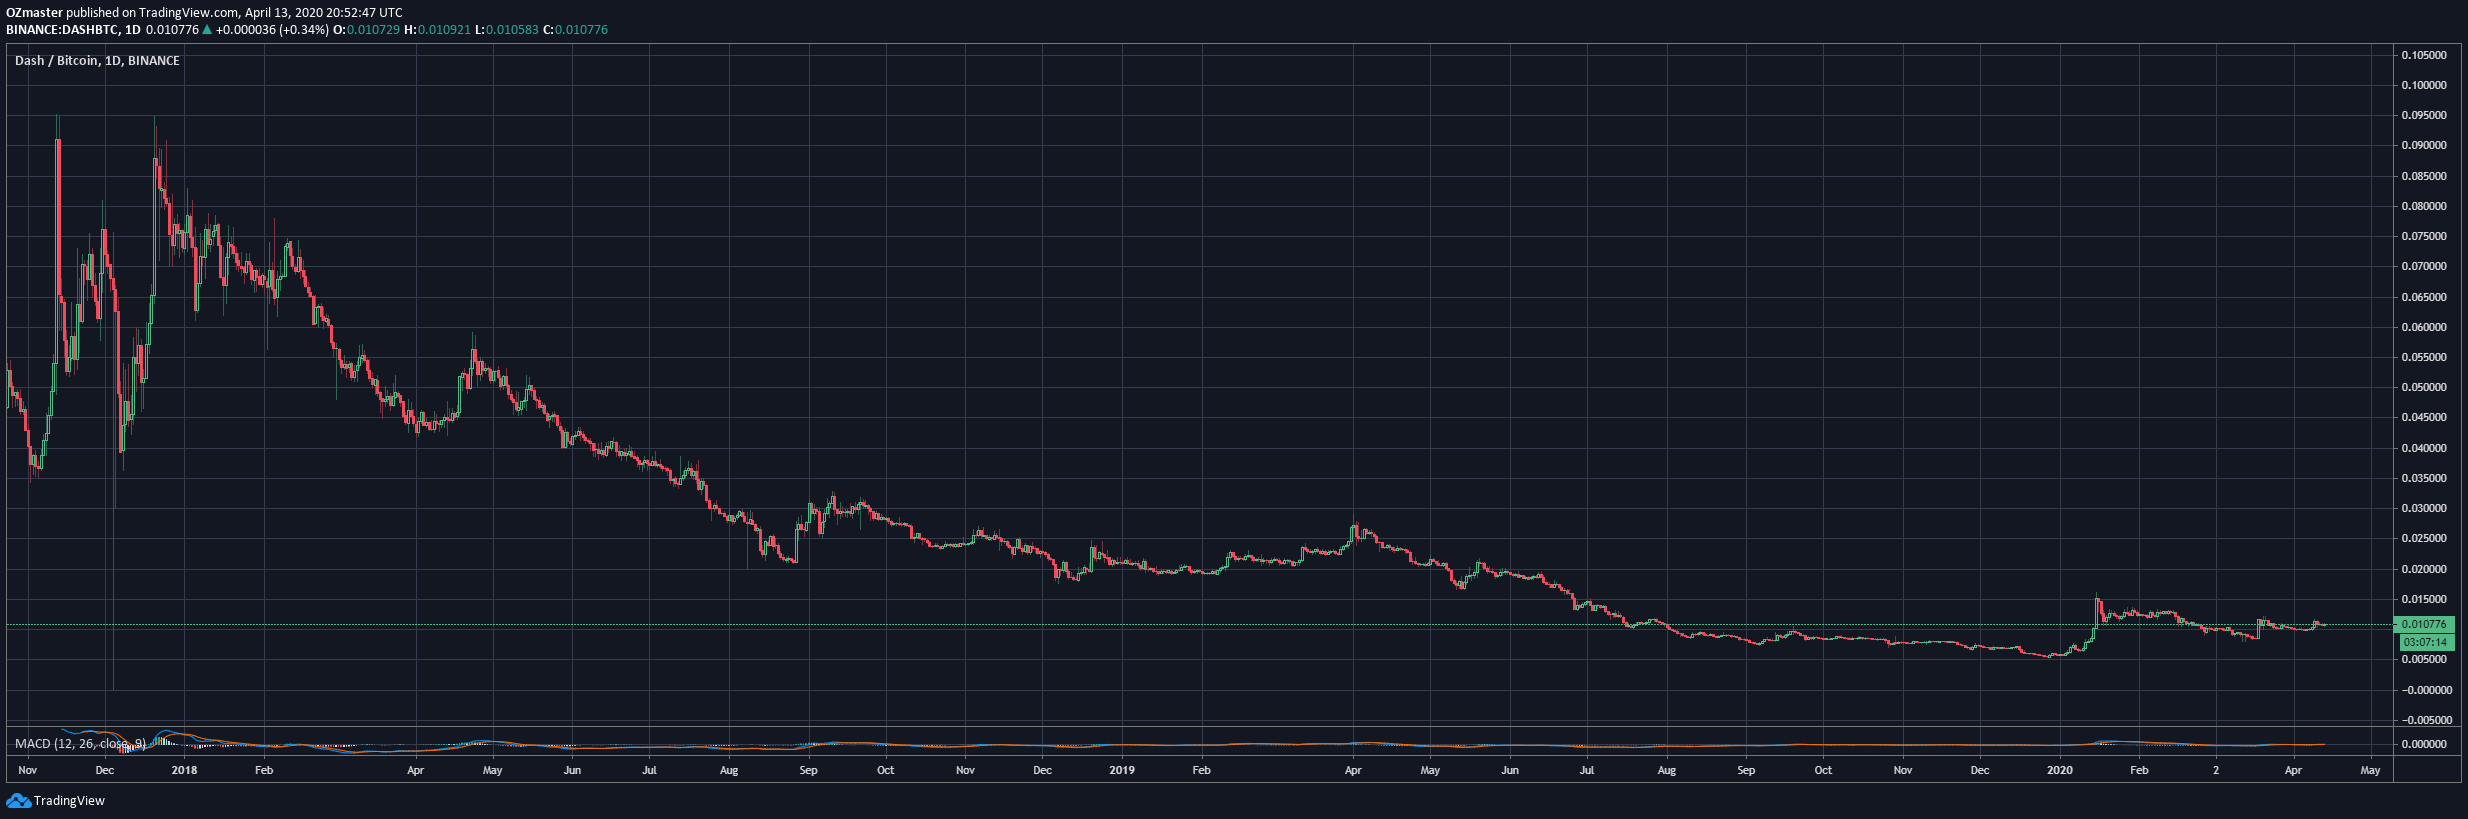
https://www.tradingview.com/x/JMWhXt0q/
The low was marked around Christmass last year around 0.0053btc and was followed 3 weeks of increasing volume and price.
The peak of this sudden rally with record volume for DASH was at 0.016btc after which the price started consolidation.
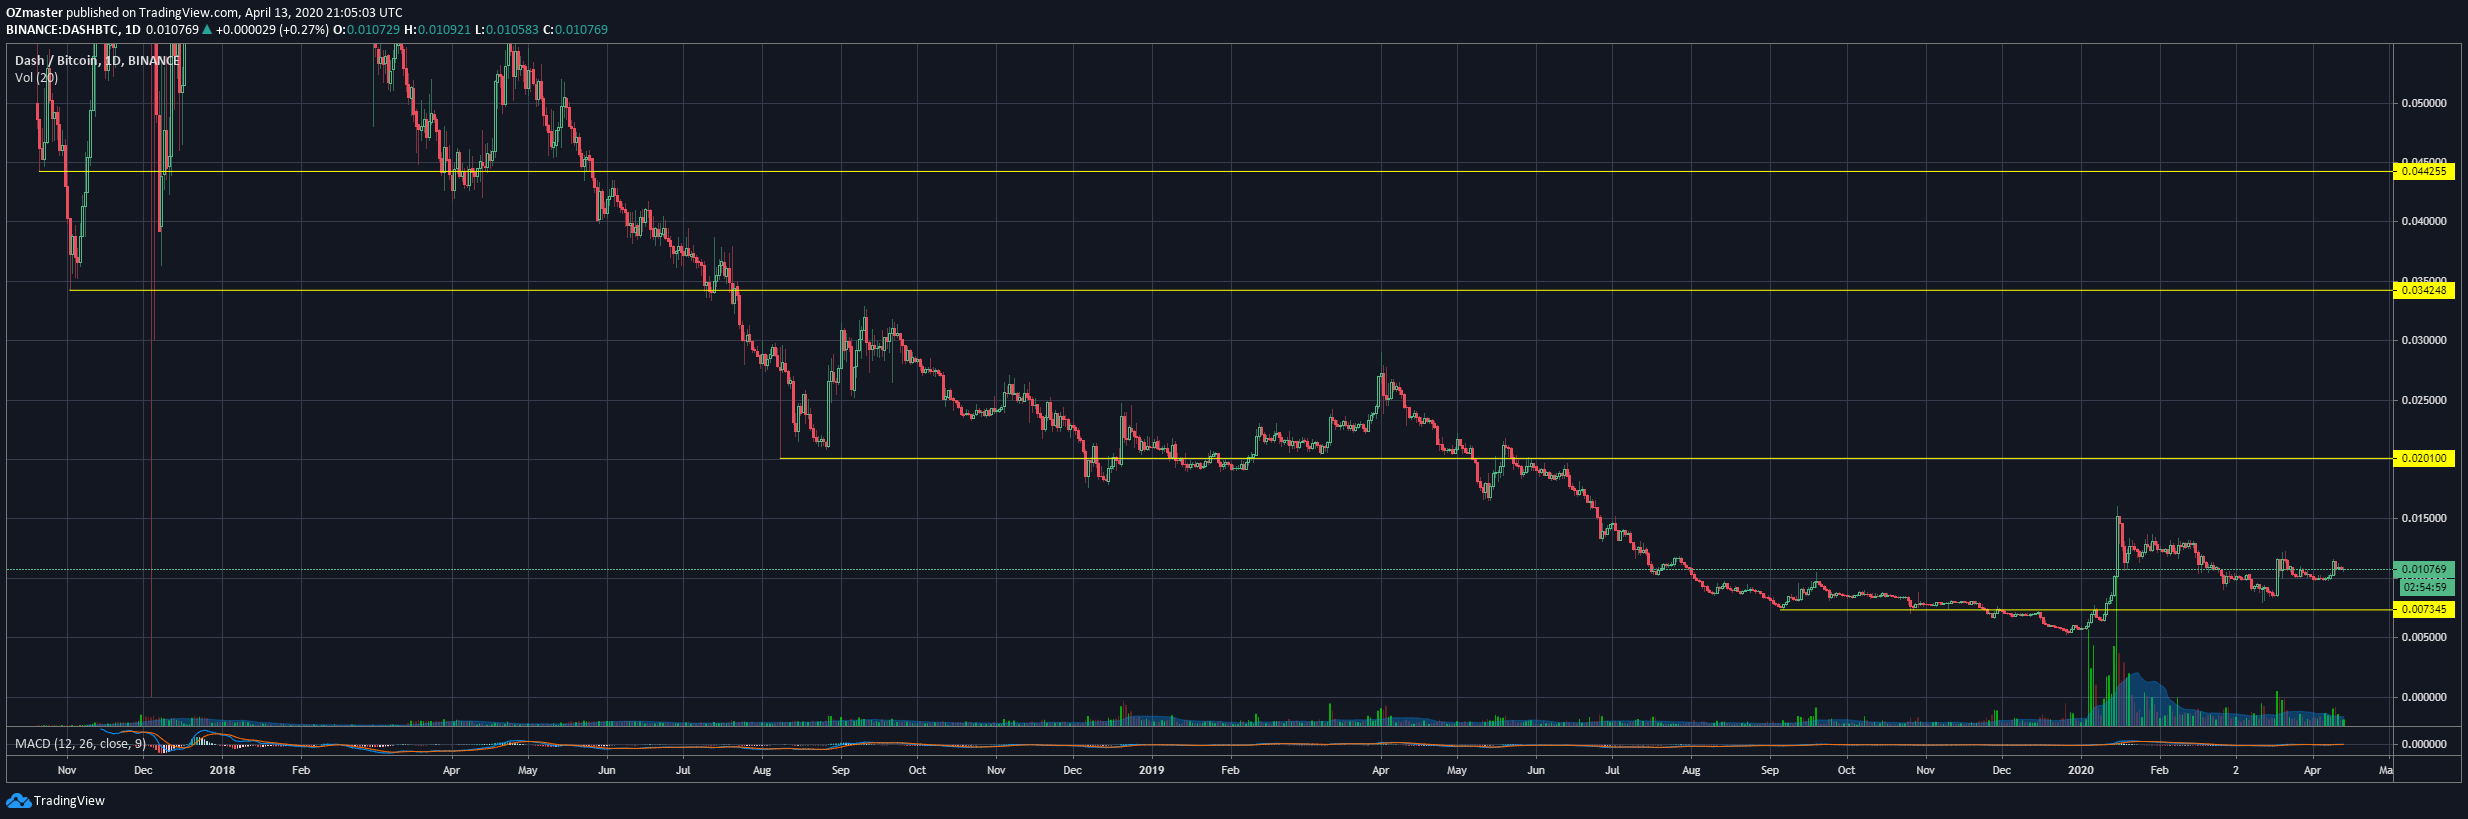
https://www.tradingview.com/x/eXzTGF4m/
Marked support and resistance areas which i see being important, to get more confirmation I will pull out my favorite tool, the Fibonacci!
Since I'm looking for a short to mid term target I won't be pulling a big fib, but rather use the recent bounce from 0.0053 to 0.016btc.
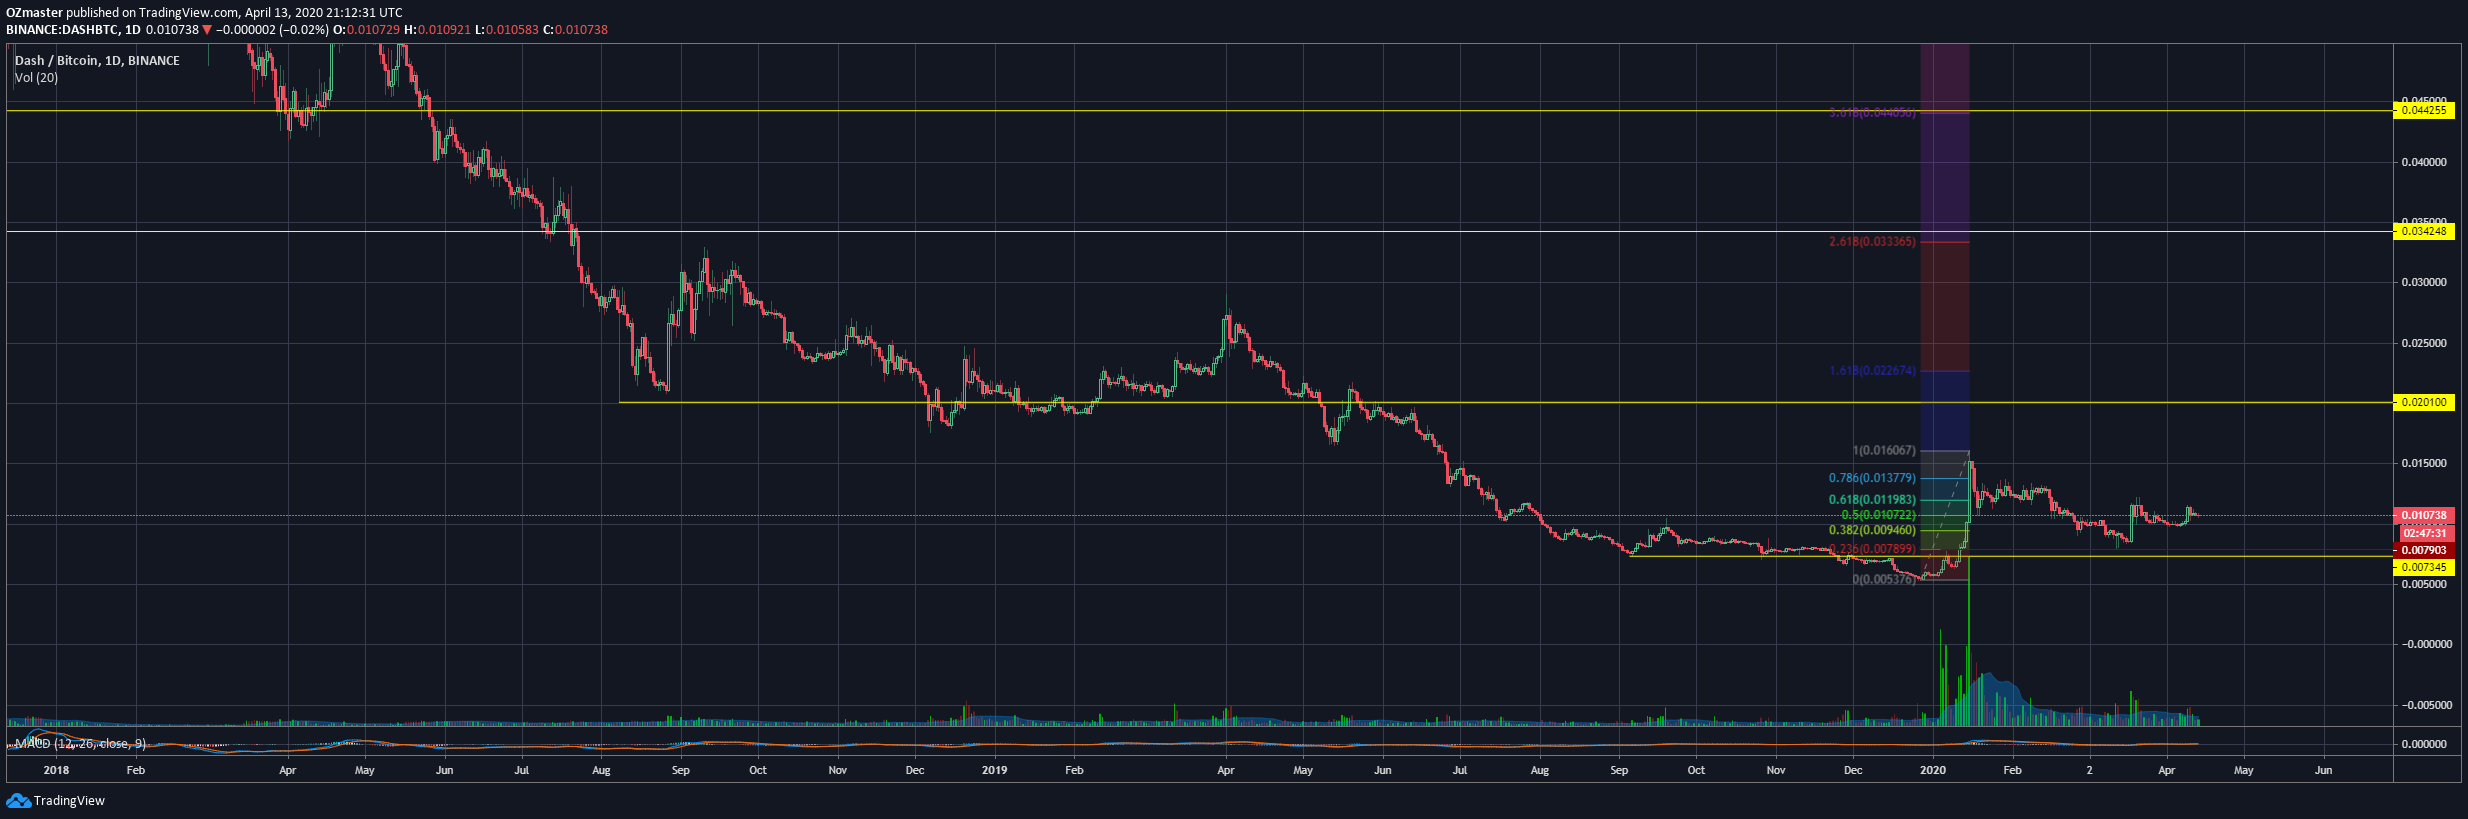
https://www.tradingview.com/x/yxGY7qLD/
Let's start from the bottom upwards, the first support line i pulled very vlosely corelates to the 0.236 fib line, to which infact the price did pull back down almost perfectly after the bounce, making that level the must hold one in order to confirm that we are heading towards my targets.
Next up is the 0.02btc line and the closest fib line to it is the 1.618 (0.0225 btc, blue) fib line, which isnt that much of a corelation.
Looking left to the history of the chart I see a lot of price action in that area with the price spending quite allot of time there, that's telling me that this area could be used as a possible pause/flattening, rather then a peak in price.
If the chart starts looking bearish I would take 0.02-0.0225BTC as my first target
The top 2 lines both closely corelate with the 2.618(arround 0.034btc) and 3.618(around 0.044btc) fib lines respectively, making them in my eyes very attractive targets on the upside.
Personaly I like the 2.618 fib line more so this would be my final target after which I see a decent chance for a hard pullback down.
Please keep in mind, this is NOT financial advice or any kind of recomandation, nor am I lisenced to give one.
Enjoy the day and good luck in the markets!
Kind regards, OZ