Hi, fellow Steemians,
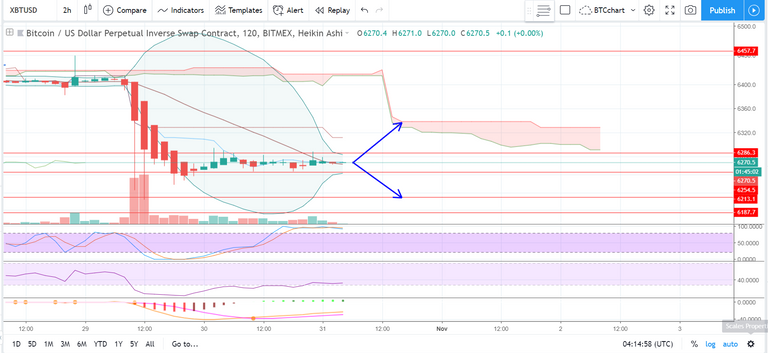
Let's have a look at the Bitcoin chart here:
As Bollinger Bands are getting tighter, and volume is decreasing, I would expect a sideways movement to continue more. However, there is two possible scenario:
- Bullish: Bitcoin will move up to the first resistance, the $6330 level
- Bearish: A dump to the lower support at $6210
Right now, I am 60% Bullish. However, to be sure, I will not trade within this area, instead, I will set up my Long position after Bitcoin break out or Short position for the same situation. Setting up your order right now is quite risky.
If you like my post, please consider to vote, resteem or comment, or you can support me by clicking on ads from dclick :)
Sponsored ( Powered by dclick )
BTC//USD Bitcoin October 2018 looking into 2019
Considering Bitcoin has maintained a $6,000 support ...

This posting was written via
dclick the Ads platform based on Steem Blockchain.

Congratulations @coinbrew! You have completed the following achievement on the Steem blockchain and have been rewarded with new badge(s) :
Click here to view your Board of Honor
If you no longer want to receive notifications, reply to this comment with the word
STOPTo support your work, I also upvoted your post!
Do not miss the last post from @steemitboard: