| Dear Hiveans | Liebe Hiver | Queridos Hiveanos |
|---|---|---|
| Today I'd like to share my favourite excerpts from the book "Intermarket Technical Analysis: Trading Strategies for the Global Stock, Bond, Commodity, and Currency Markets" (goodreads) by John J. Murphy, who is a financial market analyst and author. (wiki) | Heute meine Lieblingsauszüge aus dem Buch "Intermarket Technical Analysis: Trading Strategies for the Global Stock, Bond, Commodity, and Currency Markets" (goodreads) von John J. Murphy, einem Finanzmarktanalysten und Autor. (wiki) | Hoy mis extractos favoritos del libro "Intermarket Technical Analysis: Trading Strategies for the Global Stock, Bond, Commodity, and Currency Markets" (goodreads) de John J. Murphy, analista de mercados financieros y autor. (wiki) |
• Bond prices and commodities usually trend in opposite directions.
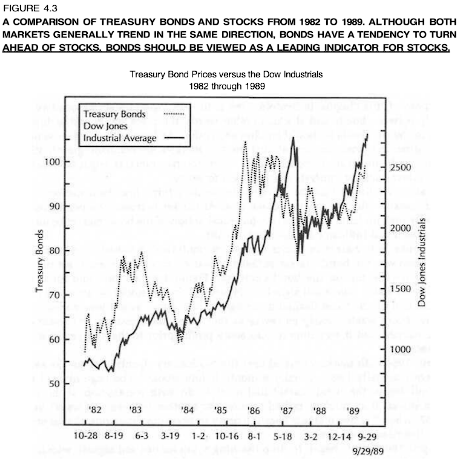
• Bonds usually trend in the same direction as stocks. Any serious divergence between bonds and stocks usually warns of a possible trend reversal in stocks.
• A falling dollar will eventually cause commodity prices to rally which in turn will have a bearish impact on bonds and stocks. Conversely, a rising dollar will eventually cause commodity prices to weaken which is bullish for bonds and stocks.
… commodity prices, represented by the CRB Index, trend in the same direction as Treasury bond yields and in the opposite direction of bond prices. Technical analysis of bonds or commodities is incomplete without a corresponding technical analysis of the other. The relative strength between bonds and the CRB Index, arrived at by ratio analysis, also provides useful information as to which way inflation is trending and whether or not the investment climate favors financial or hard assets.
During the entire decade of the 1980s, every significant turn in the stock market was either accompanied by or preceded by a similar turn in the bond market.
| We could see this in the correction of 2022: Stocks and bonds fell, commmodities soared. | Das konnten wir bei der Korrektur im Jahr 2022 sehen: Aktien und Anleihen fielen, die Commodities stiegen. | Pudimos verlo en la corrección de 2022: las acciones y los bonos cayeron, las materias primas se dispararon. |
The relationship between the U.S. dollar and bonds and stocks is an indirect one. The more direct relationship exists between the U.S. dollar and the CRB Index, which in turn impacts on bonds and stocks. The dollar moves in the opposite direction of the CRB Index. A falling dollar, being inflationary, will eventually push the CRB Index higher. A rising dollar, being noninflationary, will eventually push the CRB Index lower. The bullish impact of a rising dollar on bonds and stocks is felt when the commodity markets start to decline. The bearish impact of a falling dollar on bonds and stocks is felt when commodities start to rise. Gold is the commodity market most sensitive to dollar movements and usually trends in the opposite direction of the U.S. currency. The gold market leads turns in the CRB Index by about four months (at major turning points, the lead time has averaged about a year) and provides a bridge between the dollar and the commodity index. Foreign currency markets correspond closely with movements in gold and can often be used as a leading indicator for the CRB Index.
This chapter shows the strong link between the dollar and interest rates. The dollar has an important influence on the direction of interest rates. The direction of interest rates has a delayed impact on the direction of the dollar. The result is a circular relationship between the two. Short-term rates have more direct impact on the dollar than long-term rates. A falling U.S. dollar will eventually have a bearish impact on financial assets in favor of tangible assets. During times of severe stock market weakness, the dollar will usually fall as a result of Federal Reserve easing. Rising commodity prices will in time become bearish for stocks. Falling commodity prices usually precede an upturn in equities. Gold acts as a leading indicator of inflation and a safe haven during times of political and financial upheavals. The normal sequence of events among the various sectors is as follows:
• Rising interest rates pull the dollar higher.
• Gold peaks.
• The CRB Index peaks.
• Interest rates peak; bonds bottom.
• Stocks bottom.
• Falling interest rates pull the dollar lower.
• Gold bottoms.
• The CRB Index bottoms.
• Interest rates turn up; bonds peak.
• Stocks peak.
• Rising interest rates pull the dollar higher.
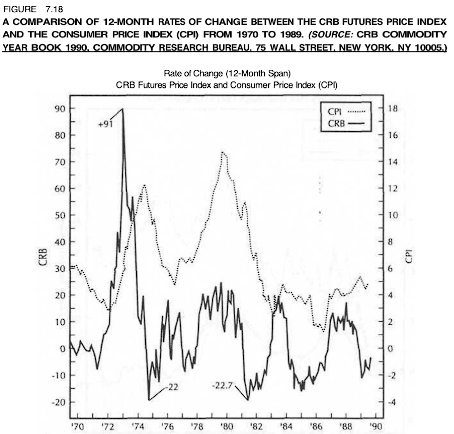
| 2 Peaks in inflation: in my opinion 1973 was mostly due to a supply shock (oil) and 1980: monetary consequences of the Fed‘s easy policy. | 2 Inflationsspitzen: 1973 war meiner Meinung nach vor allem auf einen Angebotsschock (Öl) zurückzuführen, 1980 auf die geldpolitischen Folgen der lockeren Politik der Fed. | 2 Picos de inflación: en mi opinión 1973 se debió sobre todo a un shock de oferta (petróleo) y 1980: consecuencias monetarias de la política fácil de la Fed. |
The Dow Jones Utility Average (which includes 15 utility stocks) is the most widely-watched utility index. Because utility stocks are so interest rate-sensitive, they usually are impacted by interest rate changes before the general market. As a result, utilities usually follow the lead of bond prices and, in turn, usually lead the Dow Industrials at important turns. With one exception, (1977), the Dow Utilities have peaked ahead of the Dow Industrials every time since 1960 with an average lead time of three months. The Dow Utilities have more of an impact on the industrials during times when stocks are especially sensitive to interest rates. The reasons the utilities are so interest-sensitive are because of their heavy borrowing needs and their relatively high dividends (which compete directly with yields in money market funds and certificates of deposit). The defensive qualities of utilities make them especially attractive during economic downturns and also explain their relatively strong performance at stock market bottoms.
This chapter has utilized ratio analysis to better monitor the relationship between commodities (the CRB Index) and bonds and stocks. Ratio analysis provides a useful technical tool for spotting trend changes in these intermarket relationships. Trendline analysis can be applied directly to the ratio lines themselves. A rising CRB/bond ratio suggests that commodities should be bought instead of bonds. A falling CRB/bond ratio favors long commitments in bonds. A rising CRB/bond ratio is also bearish for equities. Rising commodities have an adverse impact on both bonds and stocks. The CRB/bond ratio usually leads turns in the CRB/S&P 500 ratio and can be used as a leading indicator for stocks. The commodities included in the CRB Index should qualify as an asset class along with bonds and stocks. Because commodity markets are negatively correlated to bonds and show little correlation to stocks, an unleveraged commodity portfolio (with 10% committed to a commodity position and 90% in Treasury bills) could be used to diversify a portfolio of stocks and bonds.
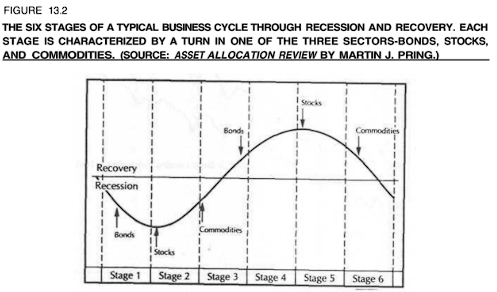
THE SIX STAGES OF THE BUSINESS CYCLE
In his Asset Allocation Review, Martin Pring divides the business cycle into 6 stages (Fig. 13.2). Stage one begins as the economy is slipping into a recession and ends with stage six, where the economic expansion has just about run its course. Each stage is characterized by a turn in one of the three asset classes—bonds, stocks, or commodities. The following table summarizes Pring's conclusions:
Stage 1... Bonds turn up (stocks and commodities falling)
Stage 2... Stocks turn up (bonds rising, commodities falling)
Stage 3 ... Commodities turn up (all three markets rising)
Stage 4 ... Bonds turn down (stocks and commodities rising)
Stage 5 ... Stocks turn down (bonds dropping, commodities rising)
Stage 6... Commodities turn down (all three markets dropping)
Leading Indicators for the 1990s, Geoffrey Moore, one the nation's most highly regarded authorities on the business cycle, details the history of bonds as a long-leading indicator of business cycle peaks and troughs. Since 1948, the U.S. economy has experienced 8 business cycles. The Dow Jones 20 Bond Average led each of the 8 business cycle peaks by an average of 27 months. At the 8 business cycle troughs, the bond lead was a shorter 7 months on average. Bond prices led all business cycle turns combined since 1948 by an average of seventeen months.
COPPER AS AN ECONOMIC INDICATOR
Copper is a key industrial commodity. It's importance is underlined by the fact that it is included in every major commodity index. This is not true of some other important commodities. No precious metals are included in the Journal of Commerce Index or the Spot Raw Industrials Index. Crude oil is included in the Journal of Commerce Index but not in the Raw Industrials Index. The only other industrial commodity that is included in every major commodity index is the cotton market. (All of the previously-mentioned commodities are included in the CRB'Futures Index.) Because copper is used in the automotive, housing and electronics industries, a lot can be learned about the strength of the economy by studying the strength of the copper market. During periods of economic strength, demand from the 3 industries just cited will keep copper prices firm. When the economy is beginning to show signs of weakness, demand for copper from these industries will drop off, resulting in a declining trend in the price of copper. In the 4 recessions since 1970, the economic peaks and troughs have coincided fairly closely with the peaks and troughs in the copper market. Copper hit a major top at the end of 1988 and dropped sharply throughout most of 1989. Weakness in copper futures suggested that the economy was slowing and raised fears of an impending recession. At the beginning of 1990, however, copper prices stabilized and started to rally sharply. Many observers breathed a sigh of relief at the copper rally (and that of other industrial commodities) and interpreted the price recovery as a sign that the economy had avoided recession.
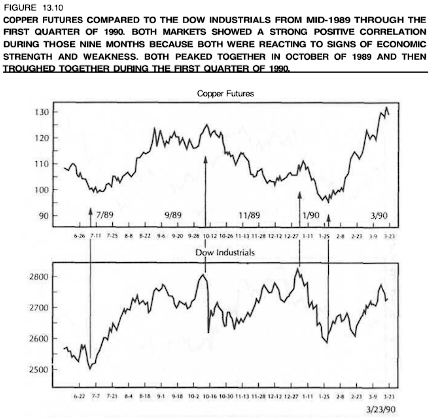
Stocks are considered to be a leading indicator of the economy. Copper is probably better classified as a coincident indicator. Turns in the stock market usually lead turns in copper. However, both are responding to (or anticipating) the health of the economy. As a result, their fortunes are tied together.
KEY INTERMARKET PRINCIPLES AND RELATIONSHIPS
Some of the key intermarket principles and relationships that we've covered in the preceding chapters are:
• All markets are interrelated.
• No market moves in isolation.
• Chart action in related markets should be taken into consideration.
• Technical analysis is the preferred vehicle for intermarket work.
• Intermarket analysis adds a new dimension to technical analysis.
• The four key sectors are currencies, commodities, bonds, and stocks.
• The U.S. dollar usually trends in the opposite direction of the gold market.
• The U.S. dollar usually trends in the opposite direction of the CRB Index.
• Gold leads turns in the CRB Index in the same direction.
• The CRB Index normally trends in the opposite direction of the bond market.
• Bonds normally trend in the same direction as the stock market.
• Bonds lead turns in the stock market.
• The Dow Utilities follow the bond market and lead stocks.
• The U.S. bond and stock markets are linked to global markets.
• Some stock groups (such as oil, gold mining, copper, and interest-sensitive stocks) are influenced by related futures markets.
COMMODITIES AS THE MISSING LINK
Another theme running throughout the book has been the important role played by the commodity markets in the intermarket picture. This is due to the belief that commodities have been the least understood and the least appreciated of the 4 sectors. The biggest breakthrough in intermarket analysis lies in the recognition of the close linkage between commodity markets, measured by the CRB Index, interest rates, and bond prices. By establishing this link, commodity prices also become linked with activity in the currency and stock markets. It's not possible to analyze the other three sectors from an intermarket perspective without considering the key role play by commodities because of the link between commodity price action and inflation. Greater appreciation of the role played by commodities and their generally negative correlation to the three other financial sectors may encourage the view of commodities as an asset class and as a potential vehicle for tactical asset allocation.
| This book is probably only interesting for financial market professionals, is loaded with graphs and tables, but gives a good overview over relationships between different assets and asset classes. | Dieses Buch ist wahrscheinlich nur für Finanzmarkt-Profis interessant, es ist voll mit Grafiken und Tabellen, gibt aber einen guten Überblick über die Beziehungen zwischen verschiedenen Vermögenswerten und Anlageklassen. | Este libro probablemente sólo sea interesante para los profesionales de los mercados financieros, está cargado de gráficos y tablas, pero ofrece una buena visión general sobre las relaciones entre los diferentes activos y clases de activos. |
Have a great day,
zuerich


Congratulations on a job well done! We are thrilled to see the outstanding results you've achieved. Your dedication and hard work have truly paid off, and it's inspiring to witness the impact you've made. Keep up the fantastic work, and know that your contributions are valued and appreciated.
!PIZZA
$PIZZA slices delivered:
@thehockeyfan-at(1/5) tipped @zuerich
!LOL
Posted using MemeHive
lolztoken.com
They're always taking things literally.
Credit: lofone
@zuerich, I sent you an $LOLZ on behalf of holovision
(3/10)
Farm LOLZ tokens when you Delegate Hive or Hive Tokens.
Click to delegate: 10 - 20 - 50 - 100 HP
Congratulations @zuerich! You have completed the following achievement on the Hive blockchain And have been rewarded with New badge(s)
Your next payout target is 62000 HP.
The unit is Hive Power equivalent because post and comment rewards can be split into HP and HBD
You can view your badges on your board and compare yourself to others in the Ranking
If you no longer want to receive notifications, reply to this comment with the word
STOPCongratulations @zuerich! You received a personal badge!
You can view your badges on your board and compare yourself to others in the Ranking