
SUMMARY
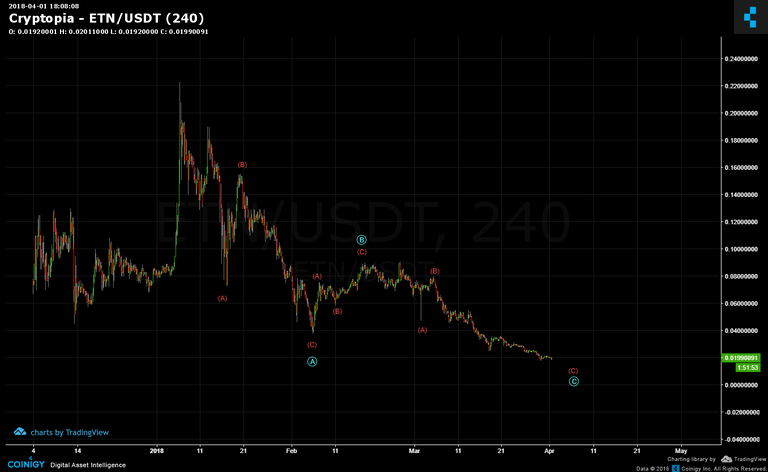
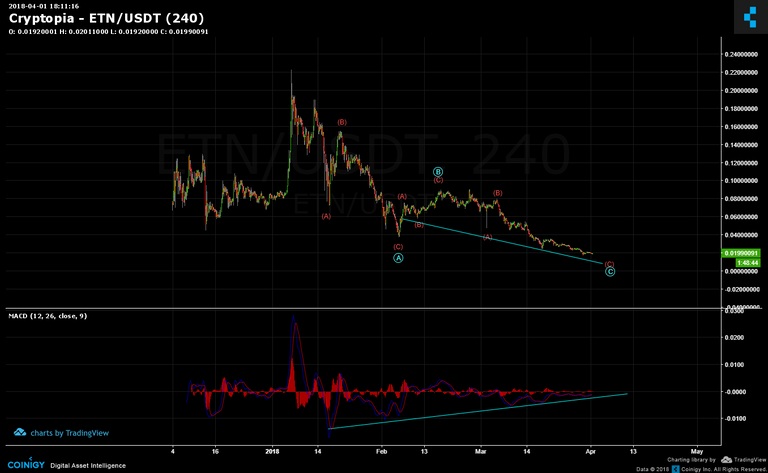
Electroneum (ETN), having hit a high of $0.22, has fallen to all time new lows. The chart below maps out a clear ABC flat trajectory and given that the correction has not yet completed, the sub penny level is realistic.
Even at the precipice of making an entry into the sub penny zone, a divergence can be seen between price and MACD. Price has been hitting newer and lower lows while the MACD has be rising and putting in incremental higher lows. This divergence doesn't last forever.
Legal Disclaimer: I am not a financial advisor nor is any content in this article presented as financial advice. The information provided in this blog post and any other posts that I make and any accompanying material is for informational purposes only. It should not be considered financial or investment advice of any kind. One should consult with a financial or investment professional to determine what may be best for your individual needs. Plain English: This is only my opinion, make of it what you wish. What does this mean? It means it's not advice nor recommendation to either buy or sell anything! It's only meant for use as informative or entertainment purposes.
Please consider reviewing these Tutorials on:
Elliott Wave Counting Tutorial #1
Elliott Wave Counting Tutorial #2
Elliott Wave Counting Tutorial #3
Laddering and Buy/Sell Setups.
Laddering Example with EOS
Tutorial on the use of Fibonacci & Elliott Waves
@haejin's Trading Nuggets
Essay: Is Technical Analysis a Quantum Event?
Follow me on Twitter for Real Time Alerts!!
Follow me on StockTwits for UpDates!!
--
--


Hi @haejin what do you think would the long term potential be for ETN? Would it ever recover to above $0.10?
Hi @haejin
Excellent article. I subscribed to your blog. I will follow your news.
I will be grateful if you subscribe to my blog @user2627
Good luck to you!
Happy Easter @Haejin & @StarJuno!!!