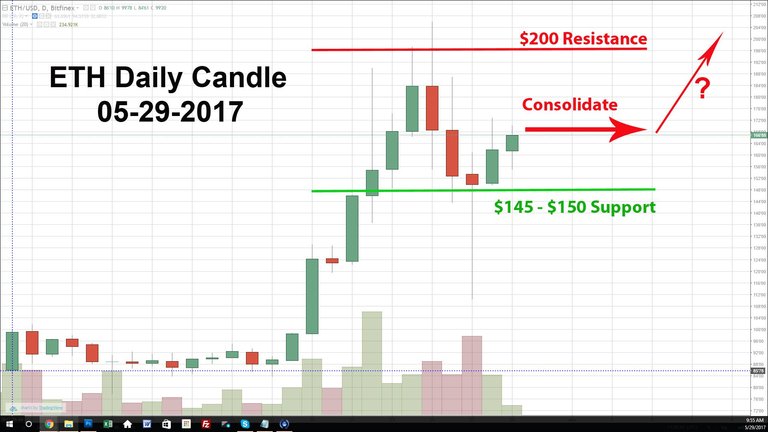
So Is the long weekend sale over? Well the chart pattern seems to said so! Let's look at the ETH daily chart above. ETH formed a convincing bullish reversal hammer two days ago then confirmed it with a nice green candle yesterday and currently is following through with another green candle today. That is a classic sign of a down trend reversal and the selling has paused at this level.
Today's daily chart clearly showing a repeating pattern similar to the previous correction. Please compare the progress with the chart I previous posted on May 27th and you will see how the price actions bounced off the 20 DMA red line and then confirming with two other green candles.
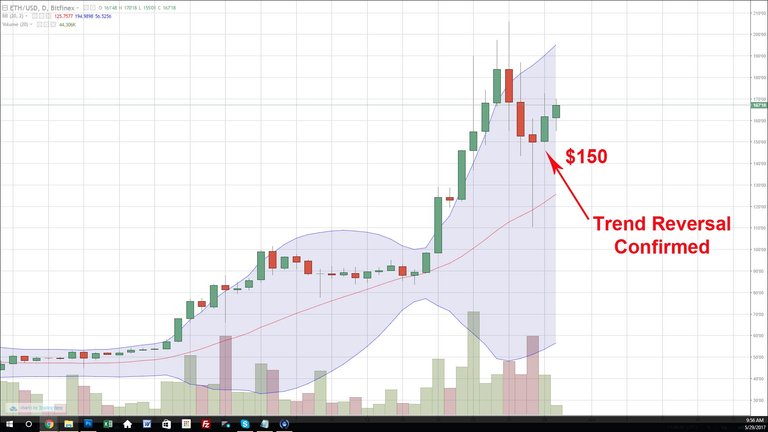
Chart Posted on May 27 As you can see the price action of the last red candle, as I was predicting a bounce off the 20 DMA red line and if ETH can form a hammer candle and then confirm with a green candle, the sellings are mostly over. Please see the previous TA here>>>>>>>https://steemit.com/ethereum/@dragonsteem/ethereum-crashed-then-bounced-what-will-happen-next-buy-this-dip-or-stay-away-technical-analysis-05-27-2017

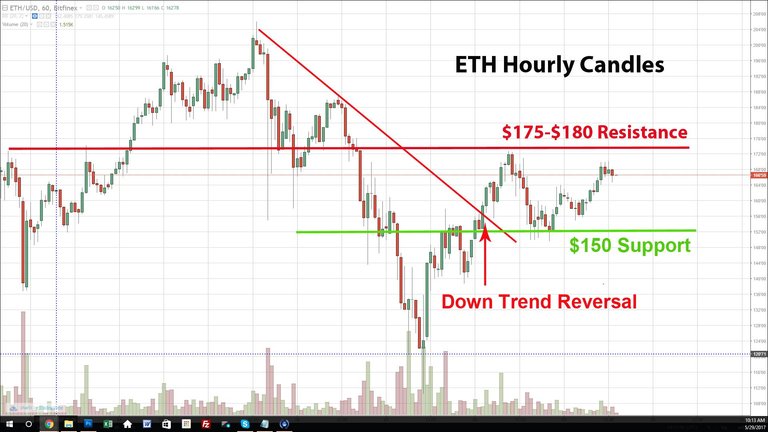
So should you start buying in now? Let's zoom in to the hourly chart to get a better look if there is any buying signal!
As you can see in this hourly chart below, ETH clearly broke out from the downtrend at $150 and then bouncing up and down in a price channel of $180 resistance and $150 support. Disciplined traders usually would trade this channel by buying around $150 and sell near $180 to yield about 20% profits until the next move. For longer term investors, $150 is not a bad entry point to buy and hold.
Enjoy your long weekend and happy Memorial Day to the people in the US.
Happy Trading!
Please like & follow me on Facebook for more news and updates. https://www.facebook.com/CryptoEverything/
Jia H