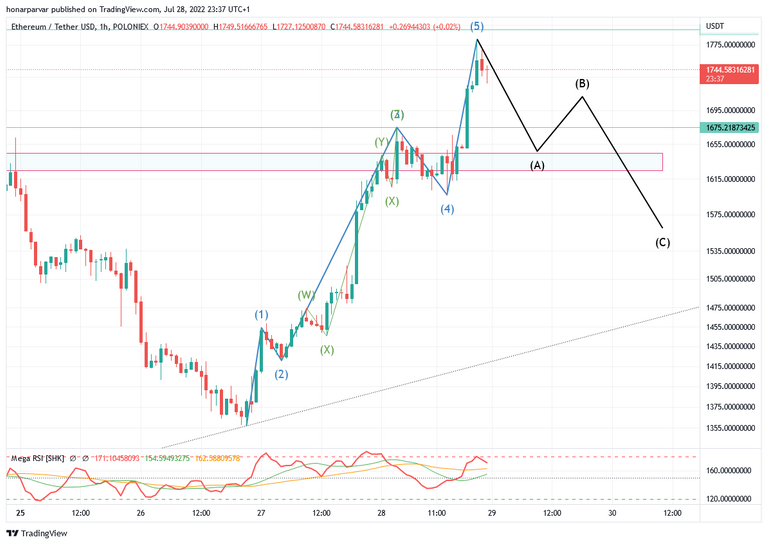
let's consider the beginning and source of the current move, the lowest level of July 26th;
Elliott impulse wave 12345 leads us to the recent high;
the 3rd wave itself can be shown as a WXYXZ combo wave;
divergence is probable (highly) in 1h time frame and if it gets confirmation, next move can be the ABC correction waves.
A ends up around the supply zone and C ends up 50% correction of the 12345 wave.

you can play the chart to see how things went on since then here: