A while back, I noticed that all publicly open versions of DeMark indicators in TradingView are different from the original (and honestly, not at all helpful). I reviewed all the private versions (which, for the obvious reasons I can’t list here). They are better. But I wanted something much better.
To me, today’s interpretations of what DeMark created are different branches of one simple and brilliant thought. People take what others made and each tries to add their own vision on top. Same story here.
At this point, I created 3 sequences, each modified from DeMark’s original formulas to work better. If you’re not familiar with DeMark’s work, here is a very brief overview: (1)qp Setup, (2)qp Countdown, and (3)qp COMBO. These are three distinct DeMark sequences that are somewhat similar in nature yet are also different stages flowing one into another.
I’m not going to go into detail because it’s much better to try it yourself and see how quickly it makes sense. I’m keeping the script free for now, so just request access Universal-Sequential-0.101
Right now, I want to describe what I see in the Ethereum market using my indicator and the ETH price charts…
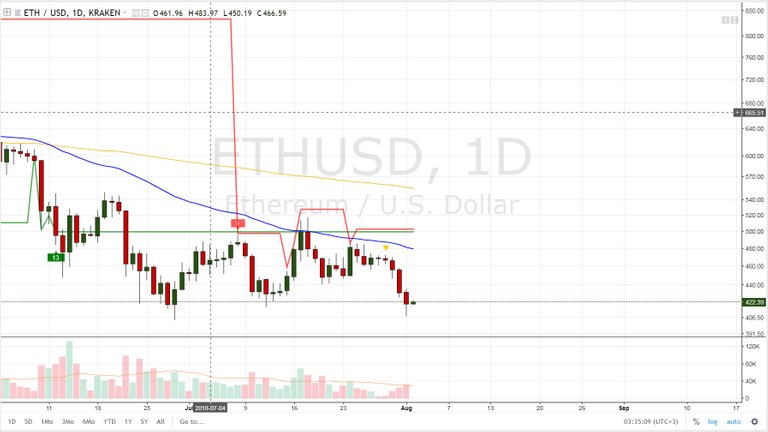
As you can see from the chart, on August 8th, the ETH/USD pair is showing a 9 at (1). At the same time, the red line ran right into it, thereby diving under the green line. That’s a pretty rare situation — only the second time in the history of Ethereum.
So what are these lines? I call them “overbuy” and “oversell.” In DeMark’s works, I’ve seen a similar line called “Stop Loss.” Playing around with the formula a bit and then mirroring it, TradingView’s interpreter showed me two lines.
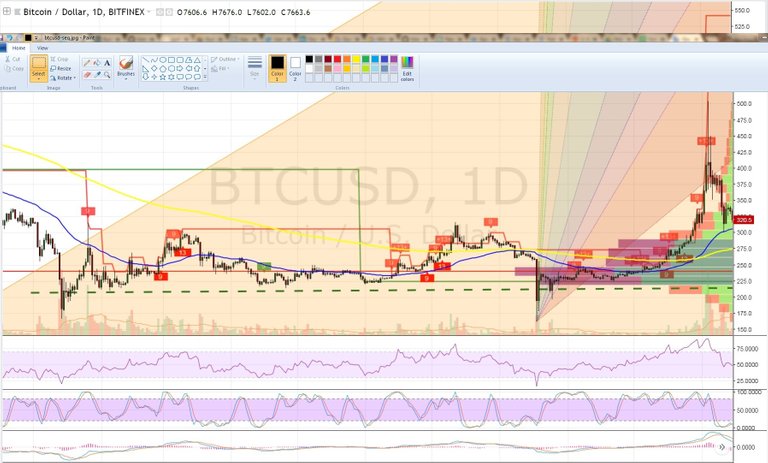
Same situation in the BTC/USD pair before the pump started in 2015–2016
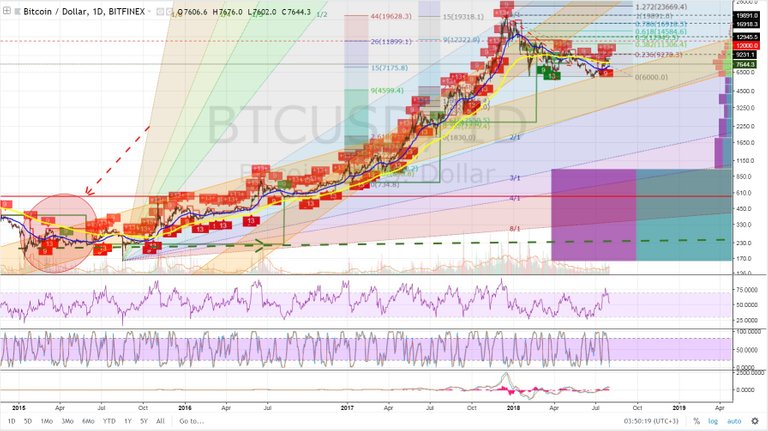
And here’s what happened afterwards.
Some can let there imagination soar. And that’s a good sign, better than not having any imagination (nor smarts).
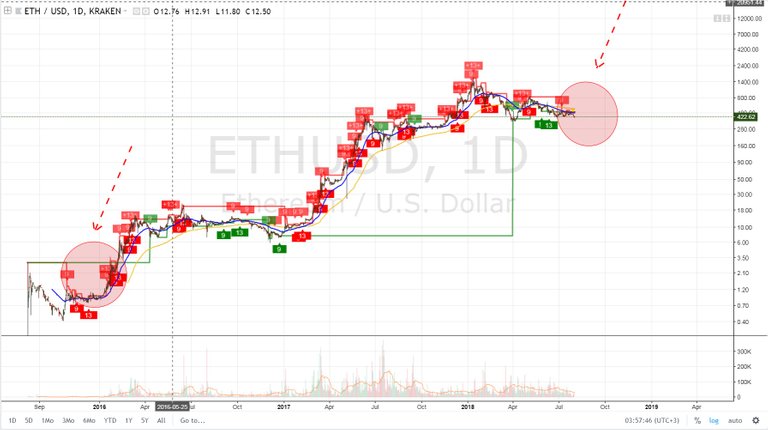
Here we see how Ethereum popped up from under the green line in 2016 and dived right back under in the second half of 2018.
So what does it all mean?
Short story: We’ll never see the crypto market so young again.
Thanks for reading — what do you think? Makes sense? Are you skeptical? Other interpretations? Comment below, I’m super curios.
Coins mentioned in post: