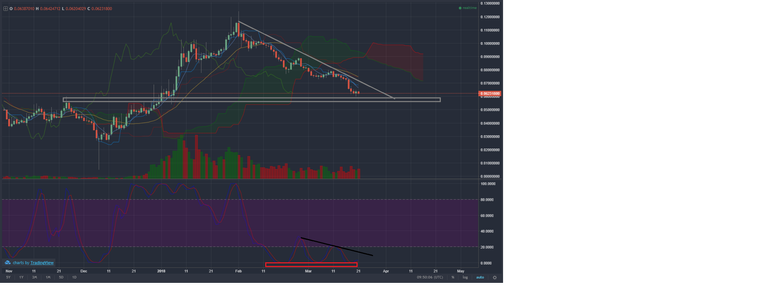
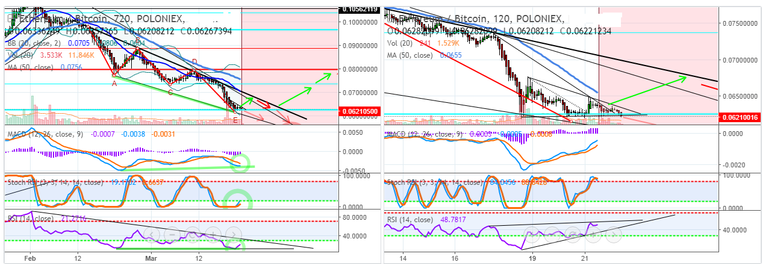
Longer term chart showing support at fib retracement line. MACD turning positive while showing bullish divergence suggesting a trend reversal. Stoch RSI turning upwards, RSI deeply oversold, turning upwards, and showing weak bullish divergence . On a shorter time scale, we see the formation of a descending triangle . At its culmination, we can expect to see either a breakout upwards and confirmation of reversal, or a breakdown to lower levels confirming more of a bearish flag/pennant formation. Longer term indicators suggesting greater weight towards a reversal, but BTC action can always throw a wrench into things.
Legal Disclaimer: I am not a financial advisor nor is any content in this article presented as financial advice. The information provided in this blog post and any other posts that I make and any accompanying material is for informational purposes only. It should not be considered financial or investment advice of any kind.

Hi! I am a robot. I just upvoted you! I found similar content that readers might be interested in:
https://www.tradingview.com/chart/ETHBTC/o0tV1E8Q-ETH-reversal/