Hello Hive friends.
Here is the daily technical look at HIVE. I pulled the 1-hour chart data from CoinGecko to see what the buyers and sellers are doing today.
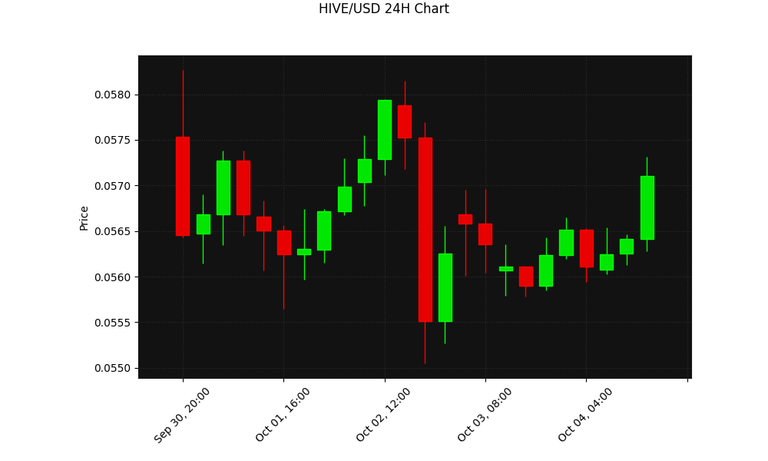
Current Price Action
HIVE is trading at $0.0571. The 24-hour trend shows clear momentum in the market.
Technical Indicators
The 14-period RSI is at 54.23. This level tells us the asset is currently in the neutral zone.
The 20-period Simple Moving Average is at $0.0565. Price is currently bullish against this line. This usually means the short-term trend is bullish.
Key Levels to Watch
Support is sitting around $0.0551. Resistance is near $0.0583.
What do you think about the chart today? Let me know in the comments.
Congratulations @amala! You have completed the following achievement on the Hive blockchain And have been rewarded with New badge(s)
You can view your badges on your board and compare yourself to others in the Ranking
If you no longer want to receive notifications, reply to this comment with the word
STOPCheck out our last posts:
El RSI en 54.23 confirma esa neutralidad, pero lo que me interesa es el volumen: sin expansión, la ruptura de los $0.0583 queda en duda. El soporte en $0.0551 es el nivel a vigilar on-chain si el precio pierde la SMA20.