Hello Hive friends.
Here is the daily technical look at HIVE. I pulled the 1-hour chart data from CoinGecko to see what the buyers and sellers are doing today.
Current Price Action
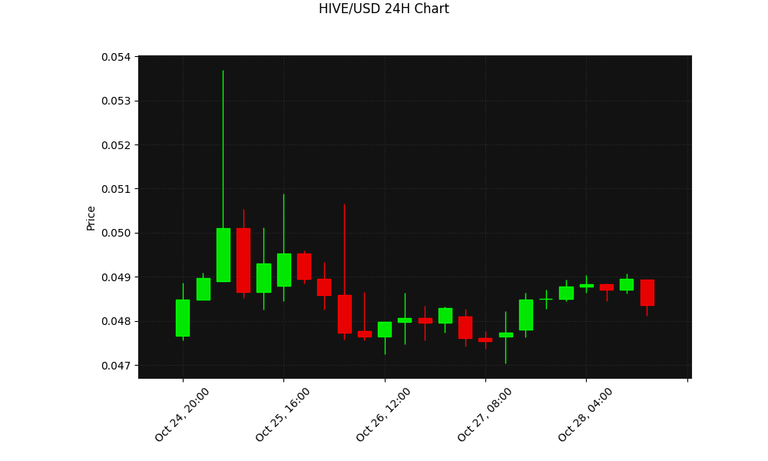
HIVE is trading at $0.0484. The 24-hour trend shows clear momentum in the market.
Technical Indicators
The 14-period RSI is at 46.09. This level tells us the asset is currently in the neutral zone.
The 20-period Simple Moving Average is at $0.0484. Price is currently bearish against this line. This usually means the short-term trend is bearish.
Key Levels to Watch
Support is sitting around $0.0470. Resistance is near $0.0537.
What do you think about the chart today? Let me know in the comments.