For an upcoming post I'm writing (on the Barbell strategy for asset allocation) I wanted to provide evidence that stock market returns are not normally distributed.
I also thought it would be fun to run the same test on Bitcoin!
This is super geeky so it won't appeal to everyone but there is a cool thing I wanted to point out (for those that are interested): Eviews (a reasonably user friendly statistics tool) can be downloaded for free.
Step 1 - Download Eviews (Free)
http://www.eviews.com/EViews9/EViews9SV/evstud9.html
Step 2 - Choose your dataset
I chose the daily S&P500 returns from the Federal Bank of St. Louis.
I then 'cleaned' the data in excel for simplicity. I removed the data set description so it was just the header and trimmed the dates (I chose 24-Oct-16 to Oct-23-17 somewhat randomly).
I also removed the "NA" rows (days the stock market was closed).
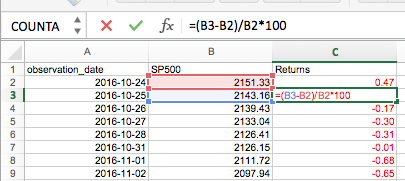
Step 3 - Calculate returns
This is pretty much self-explanatory, I'm taking the current price minus the previous day's price (that's your daily return).
I then wanted to express it as a percentage so I divided the result by the previous price and multiplied it by 100 (that way we're not dealing with small decimals).
Step 4 - Import into Eviews
This is pretty simple, just click import and locate the file. You can click through next and okay until the import wizard completes.
Step 5 - Run the Histograph
Commands: Quick, Series, Histogram and Stats.
This will produce the output below.
Interpreting the results
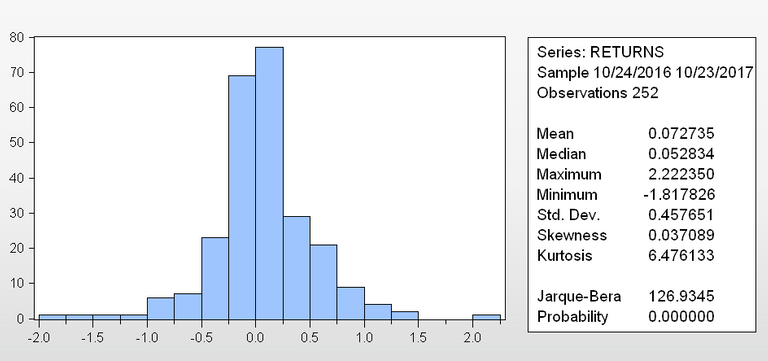
Looking at the results, the returns seem largely concentrated around the mean of 0.07% and it is reasonably symmetrical (skewness). We can already tell visually there are some 'fat tails' (statistical term is kurtosis).
While the visual observation helps - Eviews provides us with a statistical test too. In a normal distribution the Kurtosis tends to 3 and skewness tends to 0.
The Jarque Bera is a more robust assessment - its P-value is 0 which indicates that "the null hypothesis that the distribution is normal", is rejected under pretty much at all statistical confidence levels (alpha = 0.01, alpha = 0.05 etc.). It's safe to say the data set here is not normally distributed.
What this means
The normal distribution says that 68%, 95% and 99.7% of observations would be within 1, 2 and 3 standard deviations of the mean, respectively.
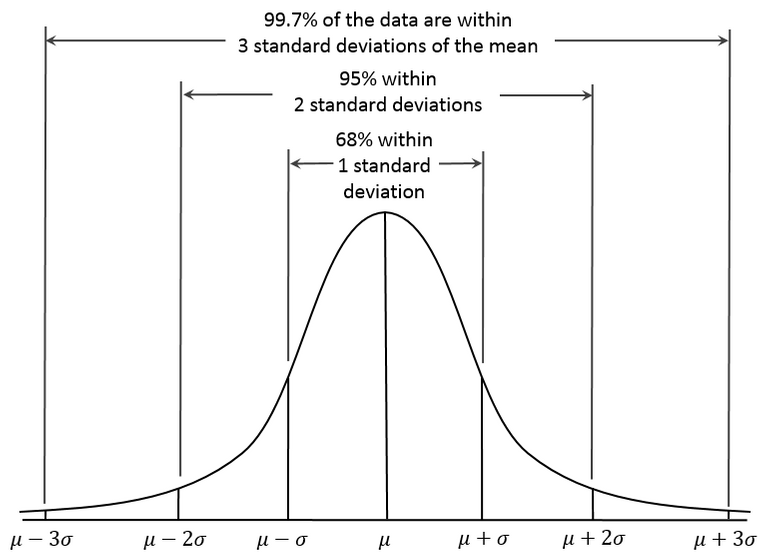
We clearly have many observations more than 3 and even 4 standard deviations from the mean (4 X 0.451649 = 1.83%, so 4 standard deviations from the mean is a 1.90% positive return or a negative 1.75% return).
So who cares? Basically, this means that Modern Portfolio Theory, the CAPM, Black Scholes and most tools in economics and finance sort of work for the most part - but are horribly wrong on occasion. We don't need stats to tell us that - we've seen it with the financial crisis, Brexit, Russia default etc.
At first you might think that's good enough... but it's not how you manage risk in your own life. You don't wear your seat belt because it works for the most part - you're planning for the unexpected. That's why I'm going to post on the barbell asset allocation strategy, a defensive risk management strategy (wearing your seatbelt) that also allows you to benefit from the unexpected.
What about Bitcoin returns?
For Bitcoin I used the daily prices from coindesk.
Running the same steps above produces the below.
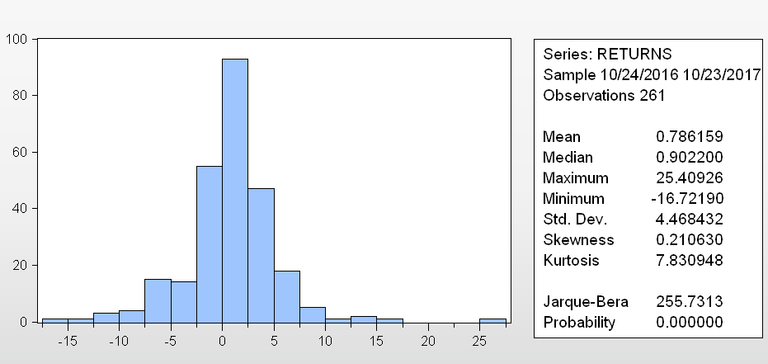
No surprise - it's not normally distributed. The tails are much fatter which because the sample's unexpected gains and losses were much larger than those of the S&P500.
The big outlier to the right is a >25% price increase in one day on 20 July 2017 - largely driven by discussions around scaling and forks.
Upvotes/comments/questions/corrections are greatly appreciated. I write what I learn - check out my post on blockchain/bitcoin for a break from stats 😉