Disclaimer: I am not an investment expert and this mini-analysis is not to be taken as investment advice. As always, do your own research and consult your financial advisor before making any investment. Also, for transparency, I am invested in the company mentioned in this article, but I am not receiving any financial compensation or reward for writing this article.
Square (NYSE:SQ)
New River Capital (The amateur expert in finance. Not licensed, obviously)

Square Inc. is showing signs of being over sold after the recent market downturn last week.
Square (traded under the NYSE ticker "SQ") is a financial services company that, originally worked to empower small and local businesses by providing seamless, semi-peer-to-peer financial transactions. Just about everyone has been to a local coffee shop or has bought from a local merchant at a farmers market where the seller had one of those little square devices that plugged into their phones or tablet that the customer can use to swipe and pay with their credit or debit card. Soon after their flagship product the company then began to offer more inclusive products like their cash registers. Again, just about everyone has used this device. Just about every small, local restaurant and coffee shop around me use this device. This transition started gaining the attention of the then powers at be and Square (led by Twitter's Jack Dorsey) was beginning to be taken seriously causing the monolithic competitors to lower transaction fees to try to eliminate Square's main selling point. However, the competition underestimated Square's ability to innovate and the smaller size of the company (compared to PayPal, Visa, MasterCard, etc.) allowed Square to take more risks and try new things. Today, Square is a financial tour-de-force. With more hardware payment options, payroll analytics services, logistics consulting, crypto exchange, and now their mobile app "Square Cash" that lets you transfer money instantly peer-to-peer and store money much like a debit card from a bank, Square is no longer the up and coming freshman player, the company has become an industry leader in fintech. In-line with the company's meteoric rise to monolithic success, the company's stock has also had its own phenomenal growth. Since the IPO a little under three years ago, the stock has gone up more than 500% far eclipsing the relatively benign growth from the S&P 500 (just over 30% in the same period).
IPOing at around $12 the stock recently surpassed $100. Investors have obviously enjoyed a fantastic run, but during last week's market downturn, the stock has lost more than 30% of it's value, so the question stands:
Has Square's best days already passed?
I'm here to say no. Besides the incredible payoff from earlier risks taken by the company, tremendous leadership, and industry tailwinds working in the company's favor as society transitions to being cashless, there seems to be some pretty strong technical indicators aligning in Square's favor.
The Tri-fecta
Three of my favorite technical indicators to watch for short-to-mid trading are:
While individually these indicators can be misleading, when all three happen at once more times than not I make a good profit on the trade. Last week, all three happened for Square and below I go through them:
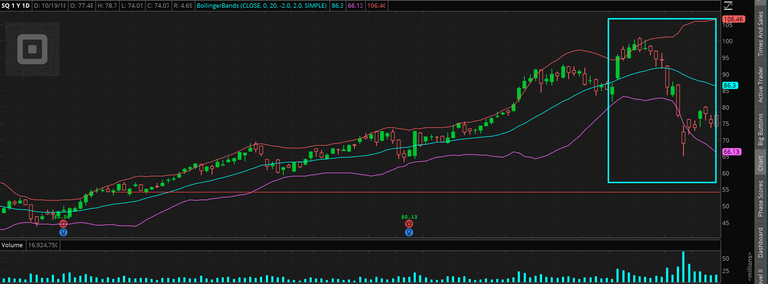
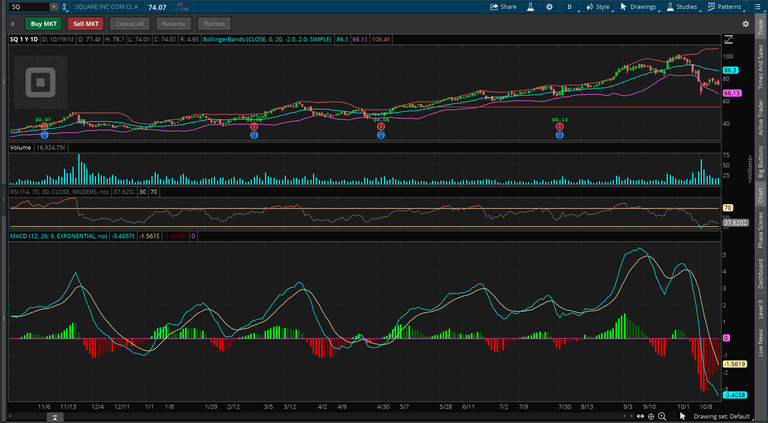
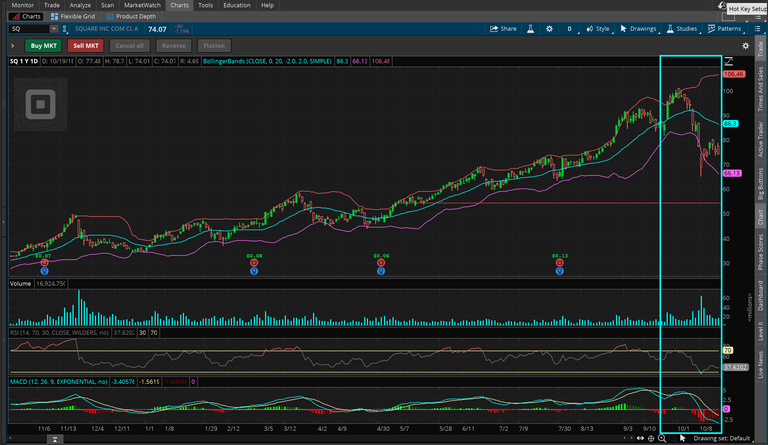
Square's trading chart (ThinkOrSwim)
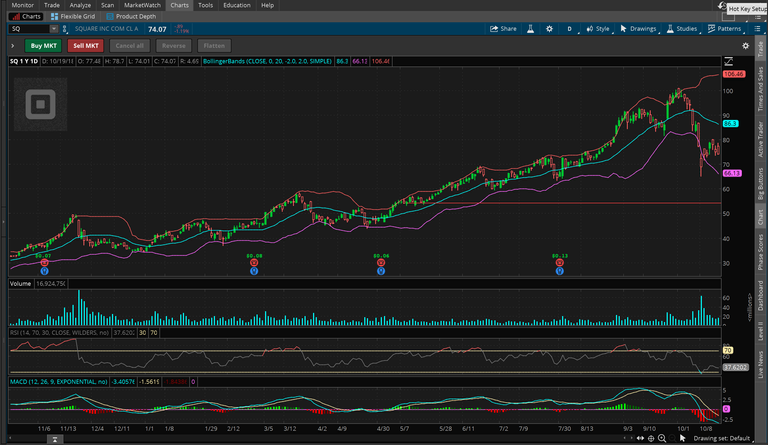
Showing the dip below the lower Bollinger Band (purple line)
Square's RSI
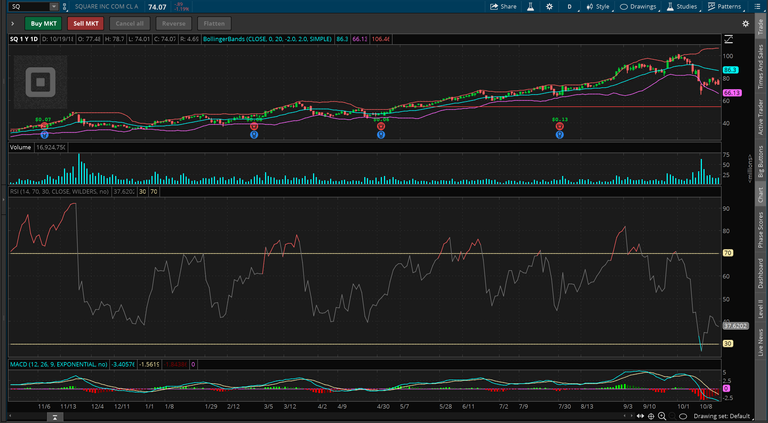
Square dipping below 30 indicating possible over-sold territory
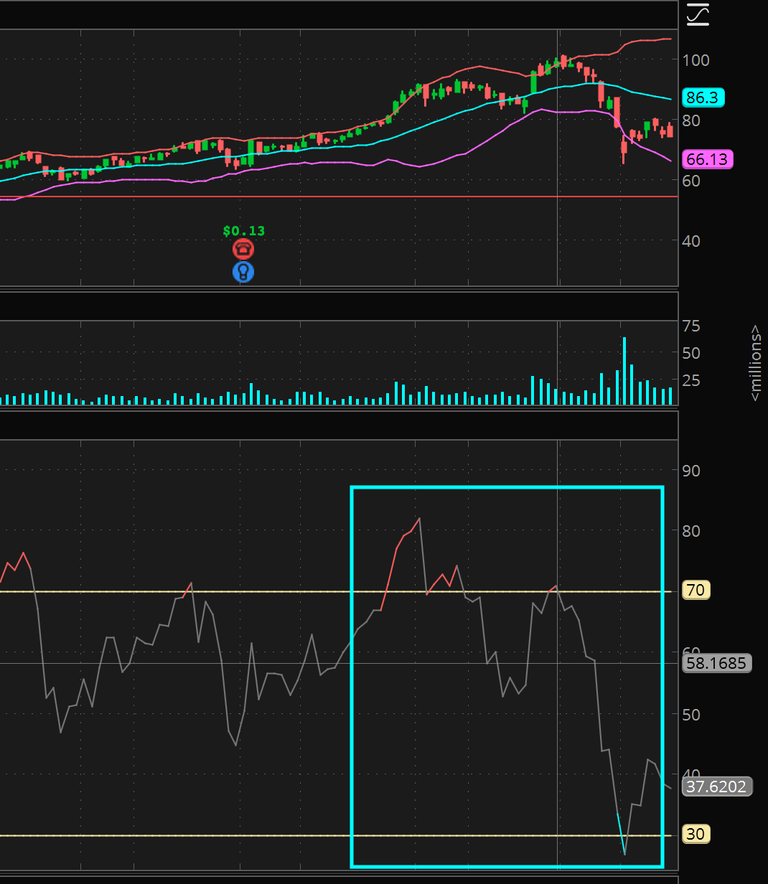
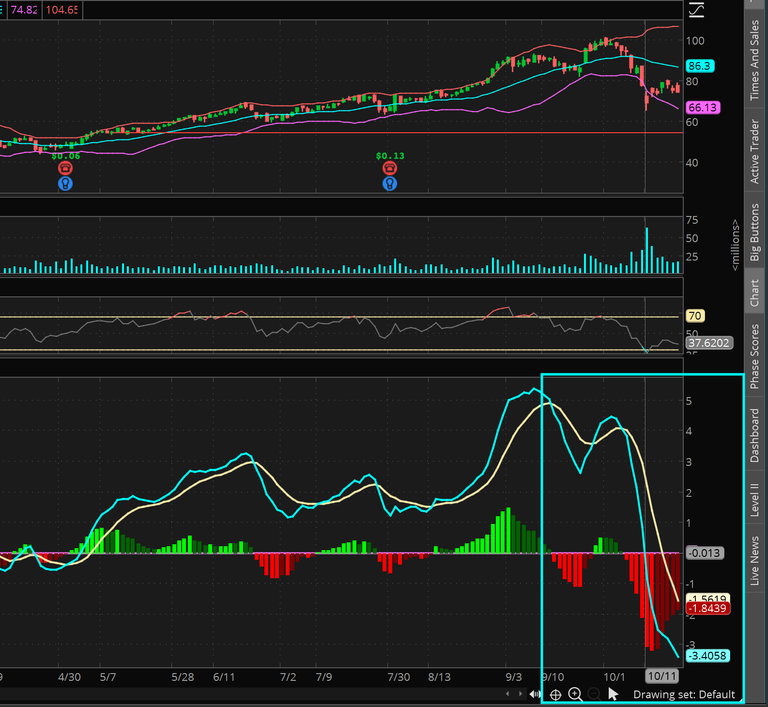
Square's MACD
Square's MACD dipping below the 3rd deviation again indicating being over-sold
Showing all indicators together showing consistency and reinforcement to the idea that Square was oversold
Now, to be fair, Square was most likely sold off last week more that other stocks because of its relatively larger volatility to the market with a beta of over 4 (with the market being a 1). This means that Square is 4x more volatile than the market on average. If The market goes up 10%, Square goes up 40%, but if the market goes down 10%, Square goes down 40%. Smart money managers, keeping their clients best interests in mind needed to sell off the stock to wait and see if the market recovered before getting back in. As the next couple of weeks pass and the market likely stabilizes it's highly likely that Square will go back up over $80 and head towards $90.
Strategy
I initiated a buy when Square dipped below $70and look to average up over the next month. Barring another market downturn the strategy should pay off since I've held Square since it was in the $30s. I've slowly accumulated more and more over time and last week gave me (someone that heavily believes in Square) to buy the stock at a perceived discount to the price it was at just a few trading sessions earlier.
Lower Risk Strategy
For those of you that are more risk adverse and prefer to not buy individual stocks and instead look to index funds and ETFs I wrote an article on Seeking Alpha awhile back on FINX, an ETF from Global X Fund that has a large holding in Square but also diversifies by investing in the entire broad basket of fintech with other holdings like PayPal, Fidelity, Intuit, etc.
You can read the comprehensive article here.
My Trading Set Up
My set up is very basic and extremely cheap. I use a laptop, TD Ameritrade's ThinkOrSwin platform for tools and charting, and trade on Robinhood.
For me, this set up works great since I don't day trade and have less than $10,000 in my portfolio.
Bonus GIF