NZDUSD Outlook for Week of Aug 15th, 2015
Technical Analysis
For all technical analysis, we want to look at the larger timeframes. The larger timeframes always control the smaller timeframes, and will give you your long term outlook. As such, we look at the NZDUSD (New Zealand Dollar against the US Dollar) on a weekly timechart. In other words, a chart graphing price against time, where each candlestick represents an entire week of price movement.
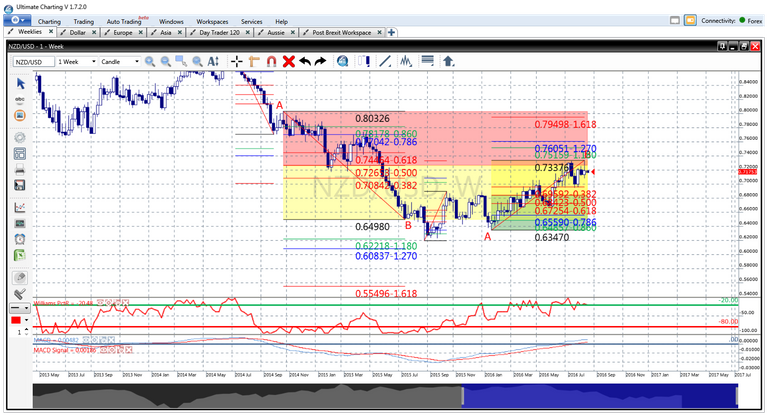
We haven't gotten into what Technical Analysis is yet, so bear with me and trust me on this one. The chart is showing a long term bearish bias, that is, the price has been steadily going down. The different colored lines and shaded areas represent Fibonacci retracements and expansions, which I use to predict direction and target for any movements. While the pair is in a downtrend, it completed a Fibonacci shown by the first A to B movement, and as the Fibonaccis predict, it then entered into a retrace. A downward trend does not mean a price falls and falls and falls. It just means that the general direction is downwards, making lower lows and lower highs. As it retraces, it started making sub-abcd movements, which are bullish in bias (going up). The retracement encroached into the red area, which is where we would have predicted, and is now free to move downwards again. So on a weekly timeframe, we would expect it to go down based on the long term bias. Based on the newer, upwards bias, we would also expect it to go down as it completed an upward sub-abcd, and now needs to retrace into the green area. So regardless of whether it will ultimately go lower or higher on the weekly chart, a movement down into the green area is very probable.
Now we can move into a shorter timeframe, in this case, a 2-hour chart.
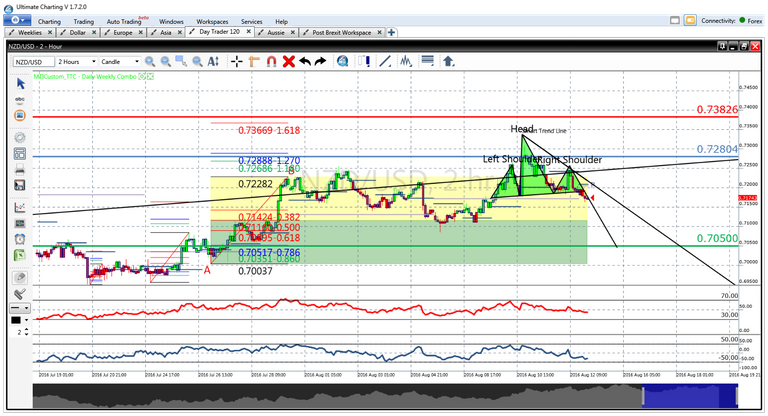
We see that in the shorter timeframe, the bias is bullish, which makes a whole lot of sense. We already saw on the Weekly chart that it is in a retrace to the North. It recently (last week) made a significant move up thanks to a fundamental announcement by the RBNZ (Royal Bank of New Zealand) regarding the interest rate. Once the sharp upward movement was finished, I expected a short term correction leading into a longer term correction. I sold this pair last week as it started dropping from its high point, labelled "head" in the chart. The price I sold it at is indicated by the blue line. My stop loss, the point where I get out of the trade with a loss if it goes against me, is at the red line. You can see it is higher than the highest point on the graph. I do not expect it to exceed the high marked by "Head" unless I have terribly miscalculated this trade. My limit, or the point where I exit the trade with a profit, is indicated by the green line. So in summary, I am risking 100 pips in return for a chance of making 230 pips. After I was already in the trade, this pair completed a textbook Head and Shoulders pattern, which is the green shaded, lopsided crown formation at the right of the chart. This is another indicator of a drop in price, which it has already started doing as I write. So my analysis on long and short term indicate the price for this pair going down, and fully justify my having sold it, with further confirmation seen after the trade.
My price points for entry, stop and limit are based on the analysis of the two charts above. I could, of course, be wrong in either direction it will take this week, or the timing. It may take more than a week. The secret to trading profitably isn't to be right each time, but rather to be right enough times that your profit exceeds the losses by a wide enough margin that it's worth your time and energy. This trade meets all my criteria, and I will remain in it till one of two things happen. The price hits the red line, taking me out with a 100 pip loss, or the price hits the green line, taking me out with 230 pips profit. A risk to reward ratio of 1:2.3, and the odds in my favor from a technical analysis perspective. If trading a full standard lot, this means you are risking US$1,000 in return for a potential profit of US$2,300.
Fundamental Analysis
There are two fundamental announcements coming out today, Monday August 15th. One is a mid-level one, at 4:30pm ET, the other the minutes of an RBNZ meeting at 9:30pm ET which is categorized as high level, having the potential to drastically move prices. At those two times, I will be closely monitoring price movements, and may temporarily adjust my stop loss to protect some of the profit I have already captured since I entered the trade. Fundamentals can trump Technicals in the very short term, and there is no sense risking realized gains needlessly. If a Fundamental pushes it higher, it can do so without me in the trade (and having exited with a profit), and once it stops rising, I'll simply enter the trade again, and effectively capture the very same pips I'd captured before, doubling my profit.
I know some of the above may sound cryptic, but I assure you it makes perfect sense if you know the rules, which I still intend to teach anyone interested. But you do need to tell me that you are interested. I'd like to know that, at the least, I am being read.
Questions? Comments? Post them below.
More in this series:
Trading the Forex Market - Part 1
Trading the Forex Market - Part 2
Trading the Forex Market Successfully
Nice post. So you will short this trade and if so, what is your entry point?
Thanks! I shorted this trade last week, at $0.72804, and it is currently trading around 80 pips below that, at $0.72000, as I write this. The only concerns short term are the two RBNZ Fundamental Announcements due later today. Or they may simply accelerate its thrust down to my limit. Either way, I'll be closely monitoring this one. If you choose to enter the trade now, 80 pips later, then I suggest you be more cautious with your stop since you have less upside to look forward to, based on my setup.
Hi all looks pretty amazing..How much do you need to invest to get started with Forex?
You can get started with US$50, trading microlots for US$0.10/pip.
An account with US$500 would allow you to safely trade minilots, for US$1.00/pip.
To trade full lots, you'd best have US$5,000 in capital, and you'd be trading for US$10.00/pip.
You are in UK, based on your handle here? You want to look at http://www.ig.com/ as your broker. They are solid, reputable and handle European customers. As an added bonus, there are no taxes for Forex profits in the UK at this time, so you keep every last penny.
Many thanks for the information and advice..I look forward to getting involved.
Not sure about the Forex - I'm a tastytrader and love those verticals! Small win today but I need the VIX to explode... It's working its way up..
The VIX is a wonderful thing, especially if you're into Options, which I also trade. The Forex is a bit different, in that you only have a few main currencies to trade on. At least, if you want to minimize your risk like a good trader. You can trade the lesser known/traded currencies, what we call the exotic pairs, but I wouldn't recommend it. The Forex is actually quite simple to trade and the profits are fantastic compared to Options, Futures, Commodities and so forth. Mainly because of the margin, but in great part because if you have studied a currency pair extensively, and keep up with both current events in the two countries as well as any Fundamental Announcements, it will become very easy to predict movements and get good entries. Keep coming at me with comments and questions! This is one topic that never bores me...