Technical Analysis Tips and Tricks #1: The EMA Crossover
Hey Steem Fam!
When trading the markets, whether that be Forex or Crypto markets, there are typically 2 methods you can go about making a decision as to which pairs or coins you want to invest in or which of those you should consider selling.
One of those methods being Fundamental Analysis, the other, Technical Analysis.
Briefly for those who are unaware of what both of these terms mean, I will try to explain in my own words, but you can find the proper definitions at Fundamental Analysis and Technical Analysis respectively, from Investopedia.com (decent resource for getting information on financial stuff).
So, Fundamental analysis is basically taking macroeconomoic factors such as the state of the economy and industry conditions as well as microeconomic factors like financial conditions and company management into account when deciding to invest in something.
This could come in the form of, for example, hearing news that something important might be implemented on a popular social platform or on the contrary, learning that a president of a country may pass a controversial law soon that does not sit well with the rest of the world.
The former suggests that the stock price of the social platform may go up (and will probably continue to go up, depending on how significant said upgrade is, and provided the upgrade to the social platform runs smoothly) and this would be a good time to buy the stock.
Wheras the latter suggests that the price of a stock/commodity might go down - once the law is passed, investors might pull their money out and would therefore send the value of the country's currency plummetting because of the disapproval of the passing of the law by the rest of the world.
Technical Analysis, is more about what we can see in the charts. It typically involves using complex mathematical indicators that can give us an indication of where the market is moving toward.
I like to think of fundamental analysis as what the market is saying vs technical analysis which is what the market is actually doing.
So let's get down to what this post is about, this is the first post out of a series in which I will share my favorite technical analysis indicators that I use to trade with. I hope to educate the next person as well as learn from more experienced guys as I am no expert in this, and this is not financial advice.
The EMA crossover is my favorite trend confirmation indicator.
EMA is an acronym for 'Exponential Moving Average'. This differes from a Simple Moving Average (SMA) in how it weights changes in price. The EMA puts more weight on recent price changes weheras SMA will put an equal weight on all price changes across its periods.
How the EMA Crossover can be used to trade
Basically, all you do is, take 1 short period EMA and one longer period EMA and look at the points of intersection of the 2.
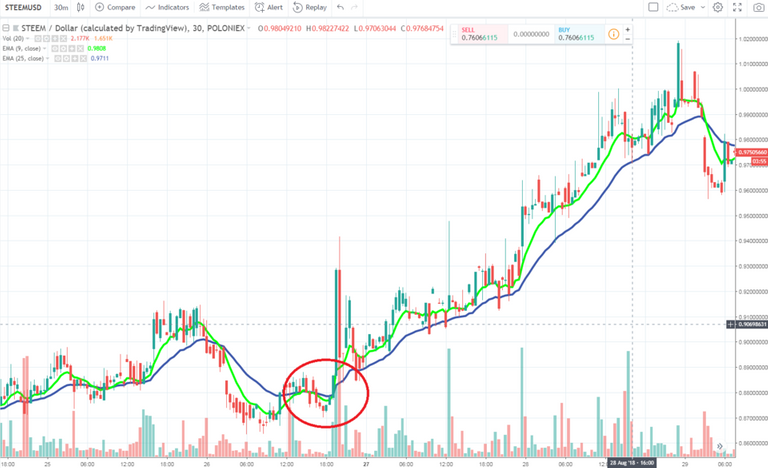
When the short EMA crosses the longer one, in the upward direction, this is a signal that the market is moving strongly in the upward direction at this point.
If you look at this STEEMUSD chart I pulled up, I circled the crossover in red. You will see the green line breaking out, over the blue line, and notice how the price stays above this point for a while... quite a while.
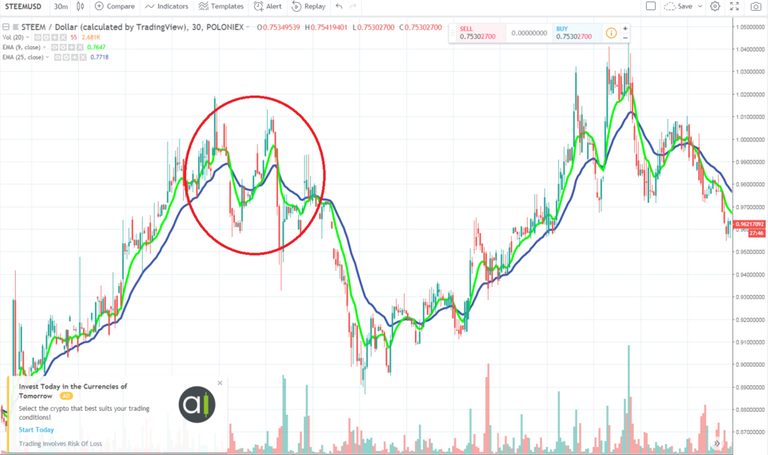
Conversely, when the shorter EMA crosses the longer one in the downward direction, this is a signal that the market is moving strongly in the downward direction. You can also see this in the image above, the gradient of the green line will slowly decrease before dipping under the blue line and this could be used as a warning of a trend reversal. If you're watching the charts you might catch it.
The picture below shows a downward crossover. I intentionally chose to snap this picture of the same chart, and made the circle extra large to show that although the green line crossed the blue one, and it seemed to be going well, the market quickly turned around again. This is to illustrate that
- There is no certainty that these indicators would always work and
- Indicators are probably best used in conjunction with other indicators
Common combinations of EMAs are 12 Day - 26 Day EMA or 50 Day - 100 Day EMAs.
Those are good if you are looking to take longer positions in my opinion, but if you are day trading and looking for quicker returns, just change the days to your period of choice (15min, 30min, 1hr etc).
I like the 7/25 combination by the way. Just found that to work for me.
That's all for this first post on Technical Analysis Tips And Tricks, next post will be on how we can use Bollinger Bands to help us make decisions in trade.
If you enjoyed this post, please do upvote, or resteem and follow @brandonmay if you don't already.
You just received a 34.45% upvote from @honestbot, courtesy of @chekohler!

Congratulations @brandonmay! You have completed the following achievement on the Steem blockchain and have been rewarded with new badge(s) :
Click on the badge to view your Board of Honor.
If you no longer want to receive notifications, reply to this comment with the word
STOPCongratulations @brandonmay! You have completed the following achievement on the Steem blockchain and have been rewarded with new badge(s) :
Click on the badge to view your Board of Honor.
If you no longer want to receive notifications, reply to this comment with the word
STOPCongratulations @brandonmay! You received a personal award!
You can view your badges on your Steem Board and compare to others on the Steem Ranking
Vote for @Steemitboard as a witness to get one more award and increased upvotes!