Markets Discussed: EURUSD, GOLD, GBPCHF and AUDSGD
EURUSD Daily Chart
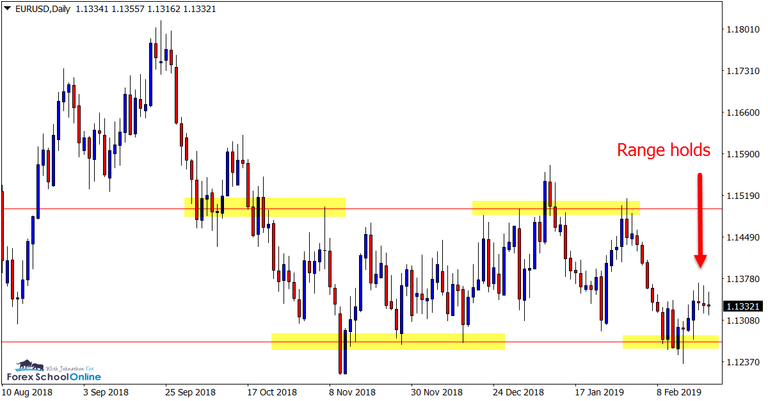
- Pin Bar at Range Low Price Moves Into Mid-way Point
Price action on the daily chart of the Euro has been stuck inside a sideways ranging box for many months.
This week after attempting to breakout and through the lows of the range, price fired off a bullish pin bar and engulfing bar to once again reject the support and move higher.
Until price makes a decisive break of this range, trading anywhere within the middle of the range looks to be incredibly tricky.
Daily Chart
GOLD Daily & 30 Minute Chart
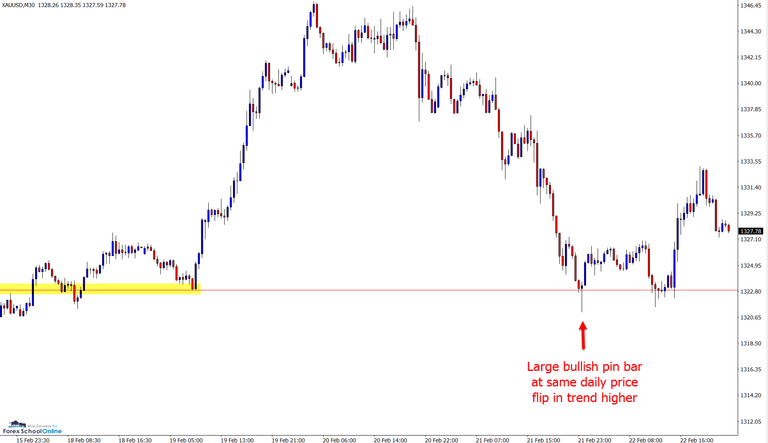
- Intraday Price Flip and Pin Bar in Strong Trend
In last weeks trade ideas we discussed this market and the strong trend higher price had been clearly moving in.
Over the past week price has continued this move, making a new high and breaking out of the daily resistance level.
We have now had an intraday test of the old daily resistance and new support, with price forming a pin bar on the 30 minute chart.
After a large move higher off the back of the pin bar, price has since hesitated. This week will be interesting to see if price can gain momentum and move back into the extreme highs that 2018 reached.
Daily Chart

30 Minute Chart
GBPCHF Daily Chart
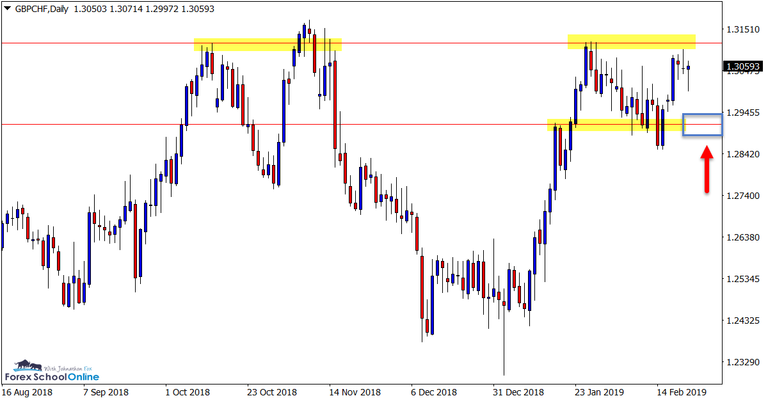
- Test of Consolidation Area to Come
Price Action on the daily chart of this pair is stuck in a consolidation period after making a recent strong move higher.
After making a solid rejection of the daily resistance level and retracing lower, price is now back at the highs and once again looking to make another test.
A break higher and through this resistance level could open the door for fast breaks and aggressive moves higher, but value traders could also watch the daily support level for price action clues if price makes a rotation lower in the next few sessions.
Daily Chart
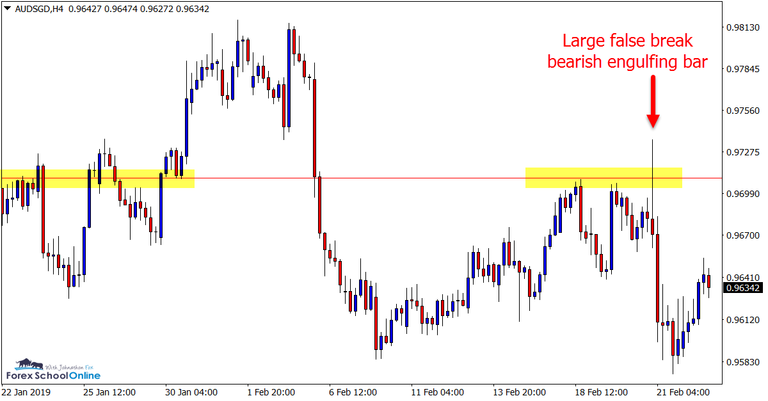
AUDSGD Daily & 4 Hour Chart
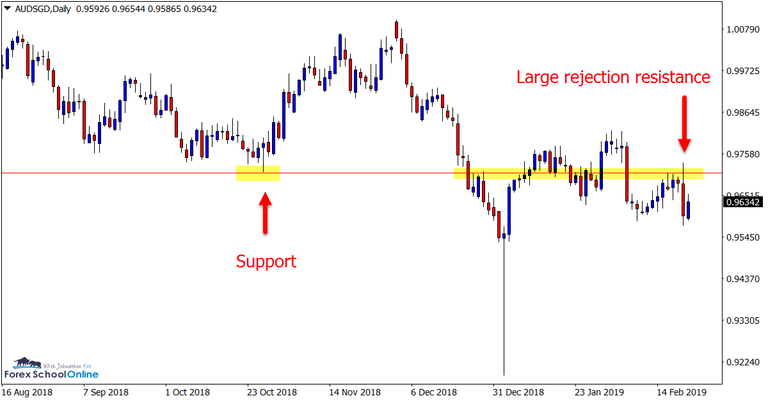
- Daily and Intraday Engulfing Bars
Both the daily and 4 hour chart of the AUDSGD fired offfalse breakBearish Engulfing Bars = BEEBs this week.
Whilst both the BEEBs were at the major daily resistance, the 4 hour chartsengulfingbarwas a lot cleaner as it was up at a swing high and had a lot more room to move lower.
The daily charts engulfing bar is yet to break lower and is sitting on a recent daily swing low support .
For any move to occur we would need to see the engulfing bar break lower, which would also see the recent daily swing low support broken.
Daily Chart
4 Hour Chart
Hi! I am a robot. I just upvoted you! I found similar content that readers might be interested in:
https://www.insidefutures.com/article/3037608/Price%20Action%20Trades%20Weekly%20Preview%20-%2025th%20Feb%20to%201st%20Mar.html
Hello @forexschool! This is a friendly reminder that you have 3000 Partiko Points unclaimed in your Partiko account!
Partiko is a fast and beautiful mobile app for Steem, and it’s the most popular Steem mobile app out there! Download Partiko using the link below and login using SteemConnect to claim your 3000 Partiko points! You can easily convert them into Steem token!
https://partiko.app/referral/partiko
Congratulations @forexschool! You received a personal award!
You can view your badges on your Steem Board and compare to others on the Steem Ranking
Vote for @Steemitboard as a witness to get one more award and increased upvotes!