Abstract
The random pairing process used by the Genesis Fractal via the breakout room feature from Zoom Video Communications, Inc. is measured to be random at greater than the 95% confidence level, and we therefore conclude that no participants are paired with any other participant more or less than is expected from a purely random process.
The number of combinations of groups with 5 or 6 participants is shown to be unspecified by Team fractally and is therefore mathematically formalized as a function of meeting size, and the particular choice of combination is shown to be consequential.
Although participants are shown to be randomly assigned to their breakout rooms, we show that the structure of the breakout rooms themselves are not necessarily assigned optimally random or fairly random. We demonstrate this by showing that Zoom's breakout room feature always minimizes the number of participants promoted to Round 2, and it is argued that the Genesis Fractal may want to instead choose the combination that maximizes the number of participants promoted to Round 2.
Introduction
Are the Genesis Fractal's weekly group breakout rooms assigned randomly? Dan Larimer wondered aloud about this during the weekly consensus meeting held on September 3, 2022. Dan noticed that he may be paired with certain people more often than he expected for a purely random pairing process, and asked if someone could provide a statistical analysis on the matter. This article provides that analysis.
The direct injection of random processes into governance is what sets Fractal Governance apart from all other forms of governance, and is what guarantees its incorruptibility and fairness. Compromising a Fractal's random processes would have disastrous consequences because the random pairings of individuals is the foundation for establishing trust in the governance of the governed. A unique contribution of this article is that it is the first known analysis of this critically important feature.
The statistical analysis techniques used in this article should be approachable to anyone with an understanding of basic algebra and basic probability theory involving simple combinatorics. If you know how to calculate basic casino odds such as the probabilities of various poker hands or the odds of rolling various sequences with multiple dice, then you will have no trouble following along. However, the conclusion for the impatient is that the Genesis Fractal's weekly group breakout rooms do pair participants randomly to a high degree of confidence.
However, although participants are indeed paired randomly into breakout rooms, we discovered that the breakout rooms themselves are not necessarily assigned optimally random or fairly random, which will be discussed fully later in the text.
The outline of this article is as follows. First we review the specifications for a Fractal's meeting size, group sizes and random group assignments. Then we review basic probability theory involving simple combinatorics by answering the following question:
Given a meeting size of n participants, what is the probability of two participants being randomly assigned to the same group of size 5 or 6?
Given this review and foundation we then analyze the Genesis Fractal's weekly measurements and compare how participants are actually paired with how we expect them to be paired according to the fractally White Paper.
Meeting and Group Size
According to the fractally White Paper the group structure of a weekly consensus meeting must have either 5 or 6 randomly assigned participants, and Fractally White Paper Addendum 1 further clarifies that this can always be accommodated with a minimum number of 20 participants. The value of 20 was chosen because it is the smallest meeting size that can always accommodate a second Round of the top 3 ranked contributors that are subsequently grouped according to the group structure requirements.
There are 9 meeting sizes smaller than 20 that can also accommodate the group structure requirement, namely meetings of size 5, 6, 10, 11, 12, 15, 16, 17 and 18. A meeting size of 10 occurs once in the Genesis Fractal's dataset, which was the very first meeting. Other than this first meeting, all other weekly consensus meetings of the Genesis Fractal have met the minimum 20 participant requirement.
Let us cast this prose into mathematical form as shown in Equation 1 and examine its solutions and consequences.
| 6 i + 5 j == n |
|---|
| Equation 1 |
| Variable | Description |
|---|---|
| n | Meeting size (number of participants) |
| i | Number of groups of size 6 |
| j | Number of groups of size 5 |
Table 1 shows the structure imposed by Equation 1 on all possible meeting sizes for a Fractal. The first column labeled Number of Rounds is the number of possible subsequent Rounds for the meeting size range in the second column labeled Meeting Size: Lower Bound - Upper Bound. The third column labeled Number of Solutions: Lower Bound - Upper Bound is the range of possible solutions to Equation 1 for the given meeting size range.
Although Table 1 shows the total number of all possible subsequent Rounds up to the maximum allowed Fractal size of 7,776 participants, the Genesis Fractal currently only allows for a total of two Rounds.
| Number of Rounds | Meeting Size: Lower Bound - Upper Bound | Number of Solutions: Lower Bound - Upper Bound |
|---|---|---|
| 1 | 10 - 18 | 0 - 1 |
| 2 | 20 - 34 | 1 - 2 |
| 3 | 35 - 59 | 1 - 2 |
| 4 | 60 - 99 | 2 - 4 |
| 5 | 100 - 169 | 3 - 6 |
| 6 | 170 - 284 | 6 - 10 |
| 7 | 285 - 474 | 9 - 16 |
| 8 | 475 - 794 | 16 - 27 |
| 9 | 795 - 1324 | 26 - 45 |
| 10 | 1,325 - 2,209 | 44 - 74 |
| 11 | 2,210 - 3,684 | 74 - 123 |
| 12 | 3,685 - 6,144 | 123 - 205 |
| 13 | 6,145 - 7,776 | 205 - 260 |
| Table 1 |
With the exception of the very first meeting, the meeting sizes of the Genesis Fractal has ranged between 20 - 46 participants, and as shown in Table 1 there are one or two solutions to Equation 1 for this meeting size range.
The choice of which solution to choose is currently left unspecified by the Genesis Fractal, but the choice is consequential because it affects the number of participants that are promoted to subsequent Rounds and therefore affects both the Fractal's group dynamics as well as the amount of Respect distributed to both participants and teams.
Table 2 shows the actual solutions to Equation 1 chosen by the Genesis Fractal in the third column labeled Number of Groups of Size (6,5), while the possible choices of solutions to Equation 1 are shown in the fourth column labeled Number of Possible Groups of Size (6,5).
Although the analysis presented in this article considered the full dataset of the Genesis Fractal, only the subset of Meeting ID 2 through 22 is used throughout the text. With the exception of the very first meeting, this subset is all Genesis meetings before Fractally White Paper Addendum 1 went into effect. This subset was chosen only for expository purposes, such as keeping the table sizes readable in the text. However, no conclusions are affected by this choice of subset.
For example, Table 2 shows that there were 46 participants for Meeting ID 2 with two possible ways to distribute these participants into groups of 5 or 6:
- Solution (1, 8) has 1 group of 6 and 8 groups of 5: 1 * 6 + 8 * 5 == 46
- Solution (6, 2) has 6 groups of 6 and 2 groups of 5: 6 * 6 + 2 * 5 == 46
In this example the second solution was arbitrarily chosen by the Genesis Fractal.
| Meeting ID | Meeting Size | Number of Groups of Size (6,5) | Number of Possible Groups of Size (6,5) |
|---|---|---|---|
| 2 | 46 | (6,2) | (1,8), (6,2) |
| 3 | 38 | (3,4) | (3,4) |
| 4 | 33 | (3,3) | (3,3) |
| 5 | 33 | (3,3) | (3,3) |
| 6 | 39 | (4,3) | (4,3) |
| 7 | 33 | (3,3) | (3,3) |
| 8 | 28 | (3,2) | (3,2) |
| 9 | 29 | (4,1) | (4,1) |
| 10 | 38 | (3,4) | (3,4) |
| 11 | 32 | (2,4) | (2,4) |
| 12 | 35 | (5,1) | (0,7), (5,1) |
| 13 | 35 | (5,1) | (0,7), (5,1) |
| 14 | 36 | (6,0) | (1,6), (6,0) |
| 15 | 35 | (5,1) | (0,7), (5,1) |
| 16 | 42 | (7,0) | (2,6), (7,0) |
| 17 | 36 | (6,0) | (1,6), (6,0) |
| 18 | 40 | (5,2) | (0,8), (5,2) |
| 19 | 33 | (3,3) | (3,3) |
| 20 | 36 | (1,6) | (1,6), (6,0) |
| 21 | 43 | (3,5) | (3,5) |
| 22 | 43 | (3,5) | (3,5) |
| Table 2 |
Table 3 shows the consequences of the choice of solution to Equation 1 actually chosen by the Genesis Fractal in the third column labeled Number of Participants Promotable to Round 2, while the possible choices are shown in the fourth column labeled Number of Possible Participants Promotable to Round 2.
Continuing the previous example for Meeting ID 2, Table 3 shows that of the 46 participants for that meeting only 24 participants would have been promoted to the second Round although 27 participants could have been promoted.
There was no actual second Round for Meeting ID 2 because this meeting occurred before Fractally White Paper Addendum 1 went into effect.
| Meeting ID | Meeting Size | Number of Participants Promotable to Round 2 | Number of Possible Participants Promotable to Round 2 |
|---|---|---|---|
| 2 | 46 | 24 | 27, 24 |
| 3 | 38 | 21 | 21 |
| 4 | 33 | 18 | 18 |
| 5 | 33 | 18 | 18 |
| 6 | 39 | 21 | 21 |
| 7 | 33 | 18 | 18 |
| 8 | 28 | 15 | 15 |
| 9 | 29 | 15 | 15 |
| 10 | 38 | 21 | 21 |
| 11 | 32 | 18 | 18 |
| 12 | 35 | 18 | 21, 18 |
| 13 | 35 | 18 | 21, 18 |
| 14 | 36 | 18 | 21, 18 |
| 15 | 35 | 18 | 21, 18 |
| 16 | 42 | 21 | 24, 21 |
| 17 | 36 | 18 | 21, 18 |
| 18 | 40 | 21 | 24, 21 |
| 19 | 33 | 18 | 18 |
| 20 | 36 | 21 | 21, 18 |
| 21 | 43 | 24 | 24 |
| 22 | 43 | 24 | 24 |
| Table 3 |
Because the choice of solution to Equation 1 is consequential and left unspecified, we recommend that Team fractally add to their specification an additional constraint that specifies which solution to choose.
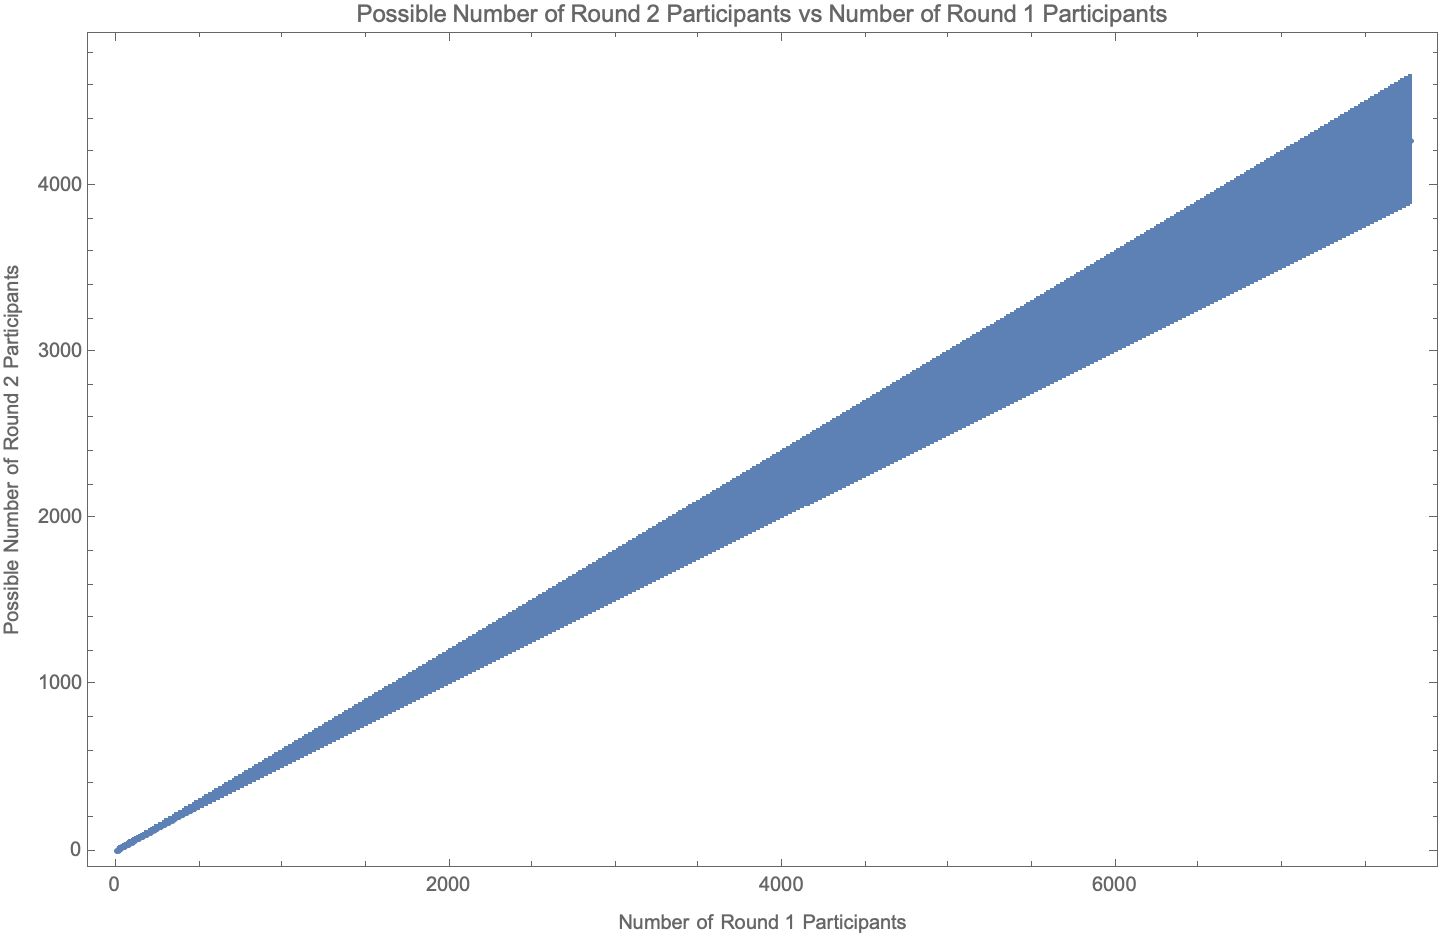
However, there is no universal best choice of solution to Equation 1, as each choice has different consequences that may benefit some Fractals to the detriment of other Fractals. For example, maximizing the number of participants promoted to a subsequent Round also has the effect of maximizing the number of groups of size 5 for some meeting sizes. Although this consequence appears at first glance to the author to be a net benefit, it should nonetheless be debated more broadly to tease out any downsides. To compound this issue, Table 1 shows that the number of choices to solution 1 grows linearly up to a maximum of 260 possible solutions for the maximum participant size of 7,776. In other words, the consequences of the choice of solution to Equation 1 also grows with meeting size.
Figure 1 shows the possible number of Round 2 participants vs the number of Round 1 participants for all possible meeting sizes up to the maximum allowed Fractal size of 7,776 participants.
 |
|---|
| Figure 1 |
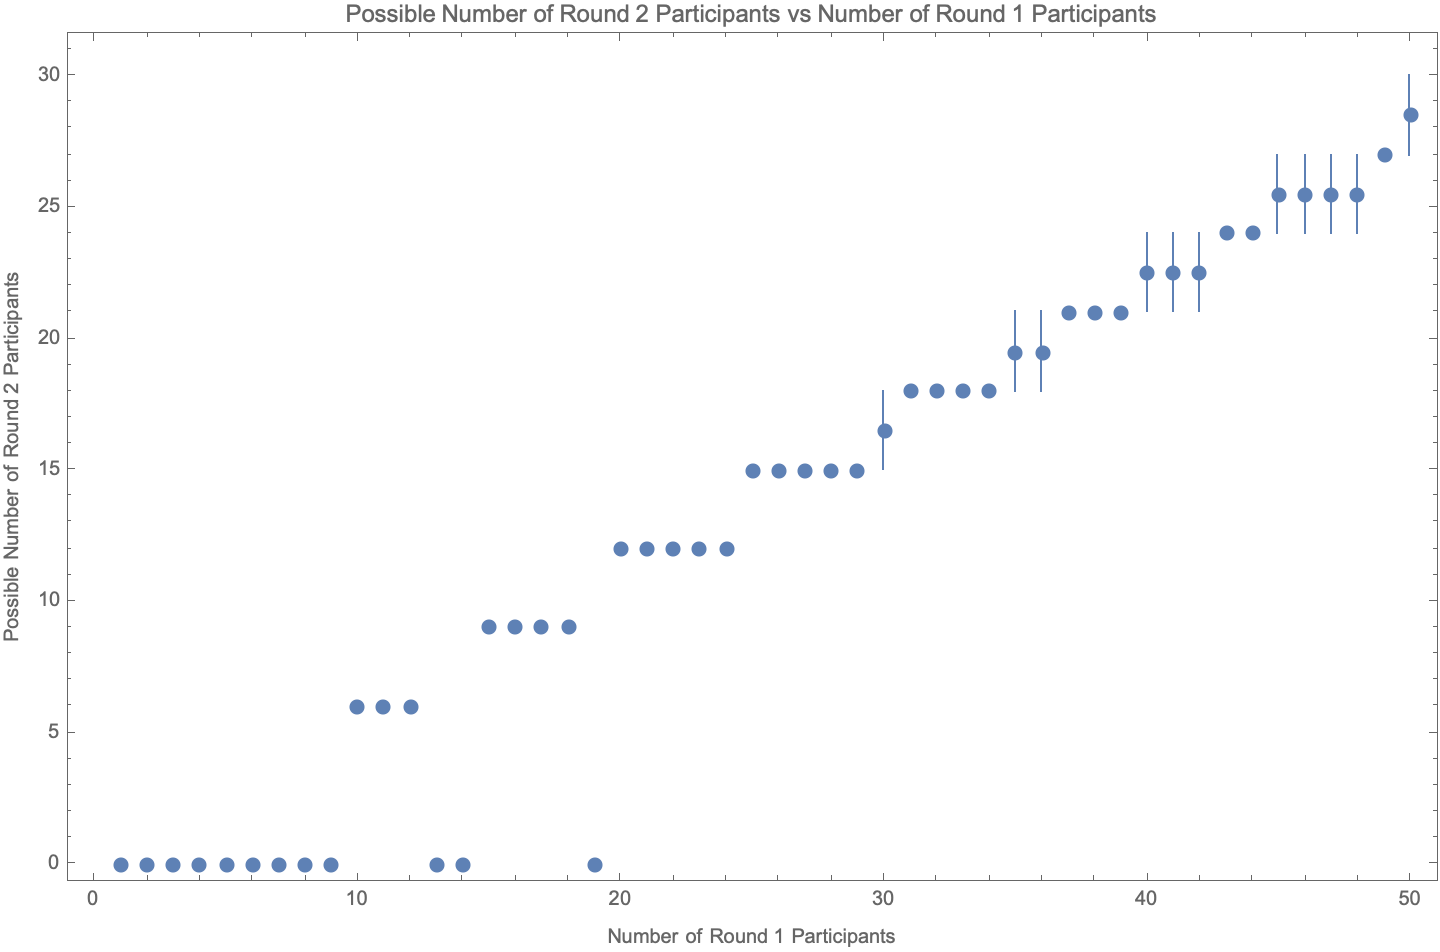
Figure 2 shows the portion of Figure 1 for meeting sizes up to 50 participants, which is the range of meeting sizes that have been relevant to the Genesis Fractal.
 |
|---|
| Figure 2 |
The Genesis Fractal currently uses the breakout room feature from Zoom Video Communications, Inc. to choose the solution to Equation 1, which appears to usually select the largest number of groups of size 6. As shown in Table 3, this minimizes the number of participants eligible for promotion to a subsequent Round.
The only meeting for which Zoom did not choose the largest number of groups of size 6 was Meeting ID 20. It is entirely possible that Zoom would have selected the largest number of groups of size 6 were it not for the manual intervention of the Genesis meeting host who must occasionally intervene to assign himself to a group after invoking the Zoom breakout room feature.
Barring other considerations, our recommendation for the Genesis Fractal is to always choose the solution to Equation 1 that maximizes the number of participants promoted to Round 2 since this has the following benefits:
- It maximizes the surface area for participants to have their contributions reviewed and assessed by their peers.
- It maximizes the amount of Respect distributed for that meeting.
- It maximizes the number of groups of size 5 which facilitates the strictly enforced 45 minute time limit on the consensus process.
Probability of Two Participants Being Assigned to the Same Group
Given a meeting size of n participants, what is the probability of two participants being randomly assigned to the same group of size of 5 or 6?
For questions like this we first answer the inverse of the question: what is the probability for the phenomena not to occur.
The probability of choosing any specific participant for assignment to a group is 1 / n, while the probability of choosing any remaining specific participant for assignment to the same group is 1 / (n - 1). The probability of both assignments occurring is the product of the individual probabilities, while the probability of both assignments not occurring is 1 minus this probability.
For example, for a meeting of size 46, which is the largest meeting size from the Genesis Fractal's dataset, the probability of 5 participants not being grouped together is p5 = (1 - 1/46) * (1 - 1/45) * (1 - 1/44) * (1 - 1/43) * (1 - 1/42) while the probability of 6 participants not being grouped together is p6 = (1 - 1/46) * (1 - 1/45) * (1 - 1/44) * (1 - 1/43) * (1 - 1/42) * (1 - 1/41).
Therefore, the probability of two participants not being grouped together is p6 * 6 * n6/n + p5 * 5 * n5/n where n6 is the number of groups of size 6 and n5 is the number of groups of size 5. Conversely, the probability of two participants being grouped together is 1 minus this probability.
This formalism establishes the Probability Distribution Function for the Genesis Fractal's group randomization process which is a function of the two variables n6 and n5, which are themselves completely determined by the solutions to Equation 1 for any meeting size n.
To help develop an intuition for this Probability Distribution Function, or PDF, Table 4 shows the probability of two participants grouping together for meeting sizes ranging from 1 participant through 20 participants. As expected, meetings of size 1, 2, 3, 4, 7, 8, 9, 13, 14, and 19 have a probability of exactly 0 for two participants grouping together because there are no solutions to Equation 1 for these meeting sizes (i.e. these meeting sizes are not possible). On the other hand, meetings of size 5 and 6 have a probability of exactly 1 for two participants grouping together, as expected, i.e. there is a 100% chance for a participant to be randomly assigned with any other participant when there is exactly one group. A meeting size of 10 has a probability of 0.5 for two participants grouping together, i.e. there is a 50% chance for a participant to be randomly assigned with any other participant given that there are exactly two groups of size 5. Finally, we note that the probability of two participants grouping together decreases with increasing meeting size, which is also what we would intuitively expect.
| Meeting Size | Probability of Grouping with Another Participant |
|---|---|
| 1 | 0.00 |
| 2 | 0.00 |
| 3 | 0.00 |
| 4 | 0.00 |
| 5 | 1.00 |
| 6 | 1.00 |
| 7 | 0.00 |
| 8 | 0.00 |
| 9 | 0.00 |
| 10 | 0.50 |
| 11 | 0.50 |
| 12 | 0.50 |
| 13 | 0.00 |
| 14 | 0.00 |
| 15 | 0.33 |
| 16 | 0.34 |
| 17 | 0.34 |
| 18 | 0.33 |
| 19 | 0.00 |
| 20 | 0.25 |
| Table 4 |
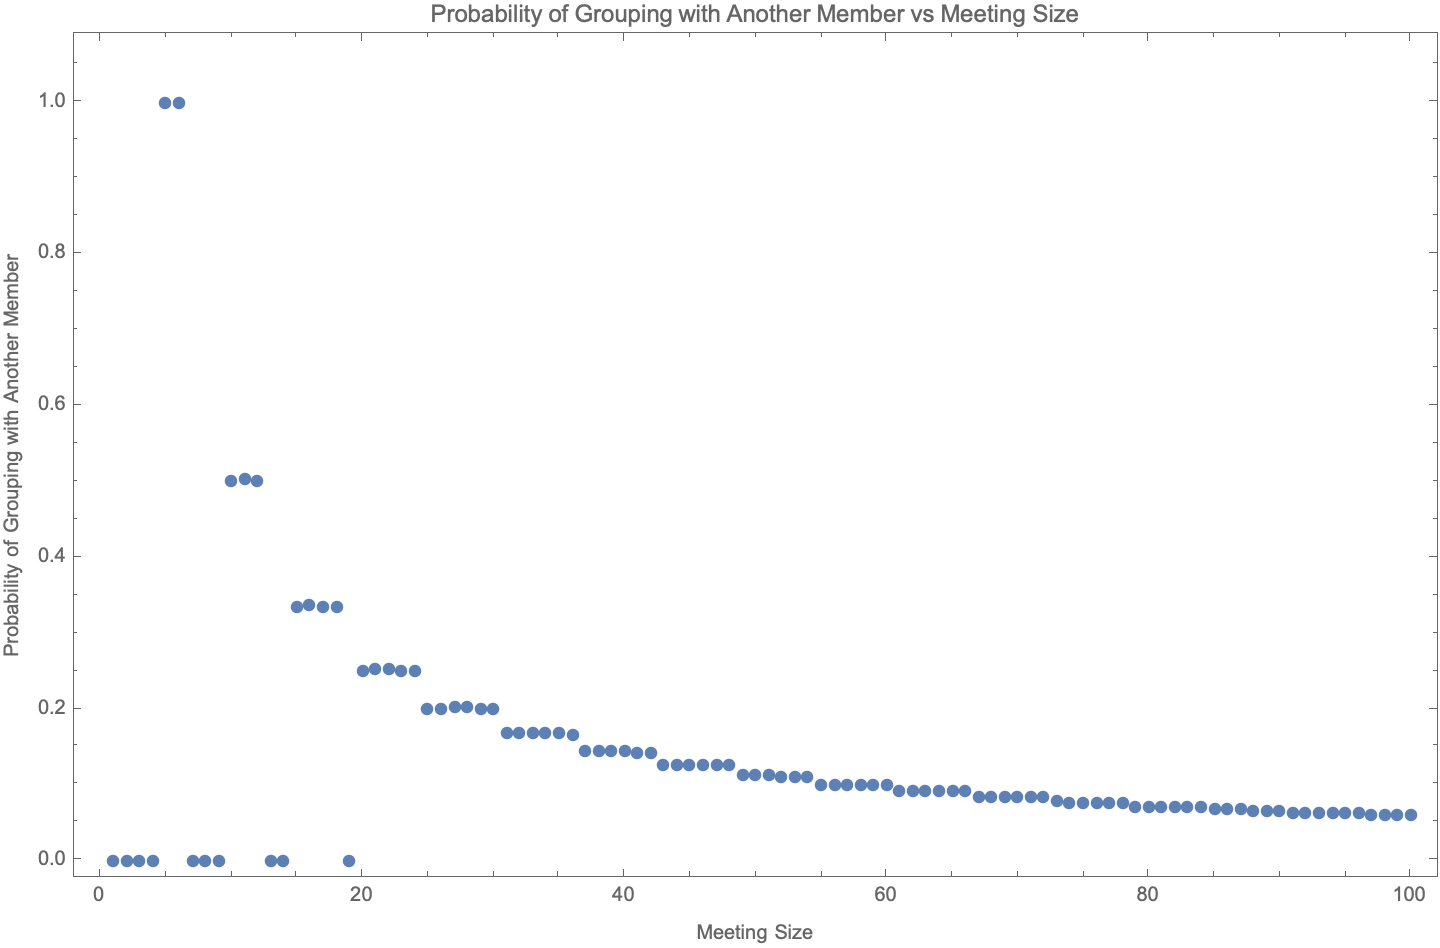
Figure 3 plots the function PDF(n6, n5) for meeting sizes ranging between 1 through 100 participants for the solutions to Equation 1 that select the largest number of groups of size 6 (i.e. this is the solution to Equation 1 chosen by the Zoom breakout room algorithm). We see all of the noticeable features described in the proceeding paragraph, and particularly that the probability of two participants grouping together decreases asymptotically towards 0 with increasing meeting size, as expected. The probability for two participants to group together for the maximum allowed meeting size of 7,776 participants using the Zoom breakout room algorithm is 1/1,296 or approximately 0.00077.
 |
|---|
| Figure 3 |
Does the Zoom Breakout Room Feature Assign Participants to Groups Randomly?
We begin this section by defining the so-called null hypothesis that the Zoom breakout room feature does indeed assign participants to their groups randomly.
Although we could go about proving or disproving this hypothesis using the exact form of PDF(n6, n5) developed in the previous section using statistical methods such as the Entropy Concentration Theorem or the Maximum Likelihood Method, we instead choose to use the Monte Carlo method for the following reasons:
- It is more intuitive than using the closed form PDF(n6, n5) because the equations become unwieldy for expository purposes.
- Using only the data itself, and therefore not using PDF(n6, n5), is a more general technique until the solution to Equation 1 is specified by Team fractally.
The Monte Carlo method allows us to quickly and reliably measure how random processes interact with and influence our designs by simulating our design repeatedly, instead of having to actually repeat them as shown in the title image of this article.
The Monte Carlo method is straightforward and simply uses the following procedure:
- Record the participant pairs that share the same groups for each meeting
- Take the participant list for each meeting
- Randomly shuffle the order of this participant list
- Reimpose the original group order and structure onto this randomized list
- Repeat steps 1 through 4 to the desired precision.
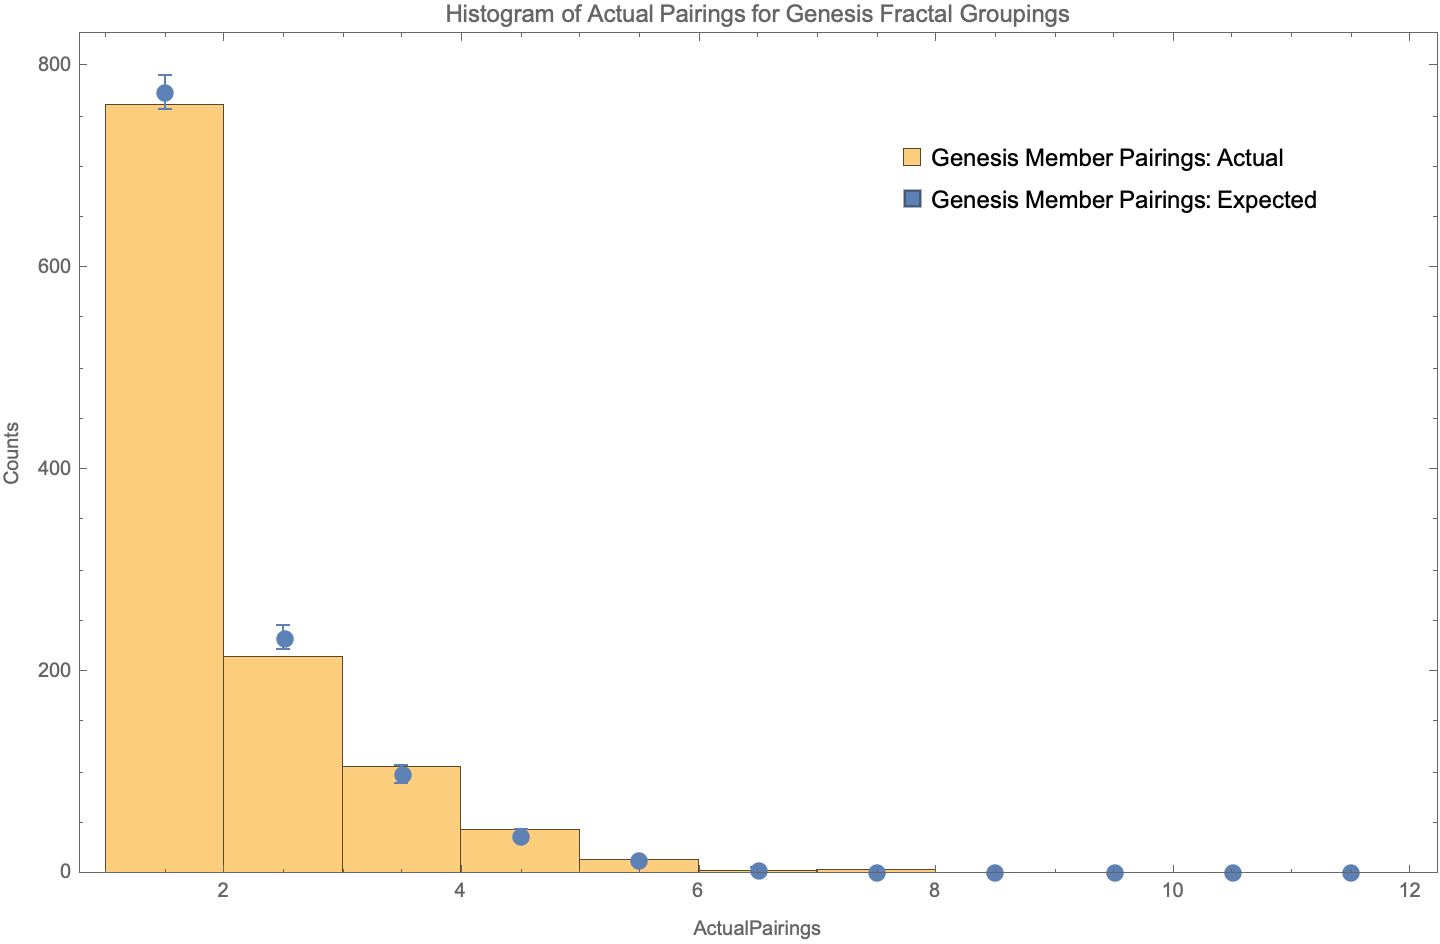
Figure 4 shows the results from 1,000 Monte Carlo iterations using the subset of Meeting ID 2 through 22 from the Genesis Fractal dataset. This is the same subset that we used in the section Meeting and Group Size which we reuse again here for consistency and expository purposes, while noting that the full dataset support the same conclusions.
 |
|---|
| Figure 4 |
Table 5 shows the values from Figure 4 in tabular form which we will use to both develop an intuition for the Monte Carlo technique and to develop a rigorous statistical test that either accepts or rejects the null hypothesis stated previously.
| Number of Pairings | Actual Counts | Monte Carlo Counts |
|---|---|---|
| 1 | 762 | 773.93 +/- 16.88 |
| 2 | 214 | 233.33 +/- 12.17 |
| 3 | 105 | 98.32 +/- 8.38 |
| 4 | 43 | 37.35 +/- 5.35 |
| 5 | 13 | 12.27 +/- 3.22 |
| 6 | 2 | 3.59 +/- 1.73 |
| 7 | 3 | 1.44 +/- 0.71 |
| 8 | 0 | 1.08 +/- 0.31 |
| 9 | 0 | 1.00 +/- 0.00 |
| 10 | 0 | 1.00 +/- 0.00 |
| 11 | 0 | 1.00 +/- 0.00 |
| Table 5 |
The second column of Table 5 called Actual Counts shows that there were 762 instances of two participants being assigned to the same group exactly once in the subset of 21 meetings, and that there were 214 instances of two participants being assigned to the same group exactly twice. For example, Dan Larimer and the author were in this group of 214 pairs. Although Dan and the author shared 18 meetings in common from this subset, they were only paired twice, which occurred for Meeting ID 7 and 12. On the opposite end of the spectrum, there were 3 pairs of participants that paired together exactly 7 times, the maximum in this subset, for the meetings that they shared together. These three participant pairs were
- "jaytaylor-node" and "mikelennie": paired together 37% of the time with 19 meetings in common
- "lionflash" and "pnc": paired together 33% of the time with 21 meetings in common
- "mikelennie" and "novacryptollc": paired together 41% of the time with 17 meetings in common
The participants "jaytaylor-node", "lionflash", "mikelennie", "novacryptollc" and "pnc" may indeed be wondering if the Zoom breakout room feature was purely random because they were paired together such a large percentage of the time, more so than any other participants.
There are multiple techniques to statistically test whether the Zoom breakout room feature does indeed assign participants to their groups randomly. One popular technique is to calculate the chi-squared test statistic using the values in Table 5, which is just the sum of the quantity (observed - expected)^2 / expected for each row in the table. The values for observed are the values in the second column called Actual Counts while the values for expected are the values in the third column called Monte Carlo Counts. The result is 9.60 +/- 3.80.
Another method preferred by the author uses the Entropy Concentration Theorem to calculate the chi-squared test statistic directly by calculating the entropy of the system using the function PDF(n6, n5) developed in the section Probability of Two Participants Being Assigned to the Same Group. This method is more intuitive than calculating the sum of the quantity (observed - expected)^2 / expected for each row in the Table 5, but is not as well understood outside of the physics community. The point is that there are many statistical methods available to us. The choice for this article was motivated by expository reasons with the target audience in mind.
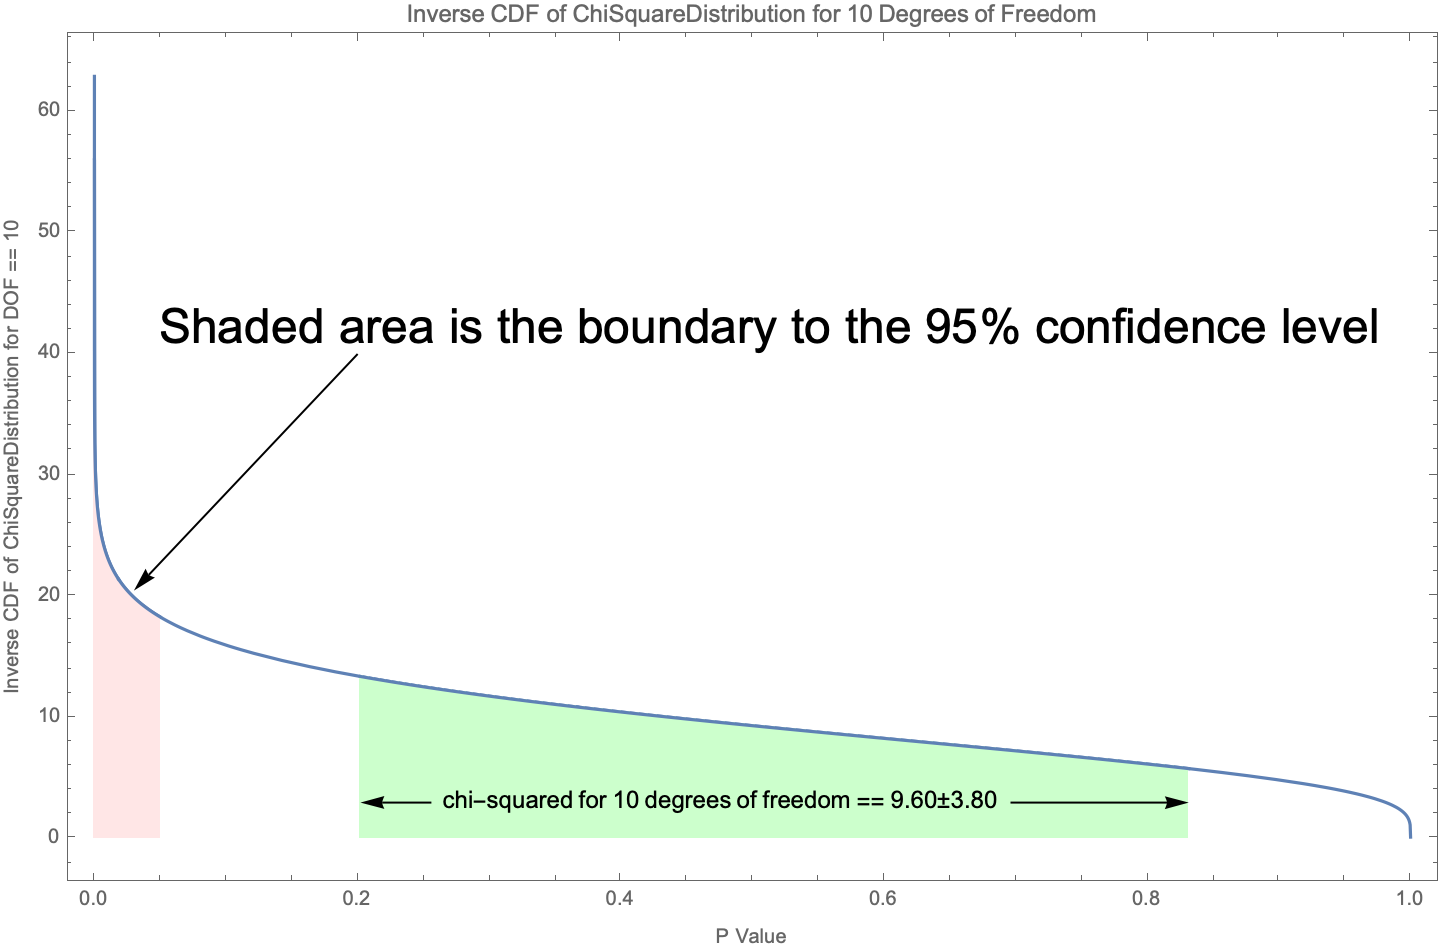
Because there are 11 rows in Table 5, and therefore 11 terms in our sum of the chi-squared test statistic, there are 11 - 1 == 10 degrees of freedom because not all 11 terms are independent (i.e. one of the terms is entirely determined by the sum of the others). The integral of the chi-squared distribution for 10 degrees of freedom at a P value of 0.05 (aka the 95% confidence level) is 18.307 as shown in Critical Values of the Chi-Square Distribution. Because our measured value of chi-squared, 9.60 +/- 3.80, is not greater than 18.307, we cannot reject our null hypothesis that the Zoom breakout room feature assigns participants to their groups randomly. Or, said another way, the Genesis Fractal's weekly group breakout rooms do pair participants randomly to a high degree of confidence.
Figure 5 shows a plot of the inverse of the cumulative distribution function for the chi-squared distribution for 10 degrees of freedom with the various quantities highlighted that were calculated in this section. As the figure shows, the Genesis Fractal is comfortably within the range of random pairings for their weekly breakout rooms.
 |
|---|
| Figure 5 |
Conclusion
The number of combinations of groups with 5 or 6 participants was shown to be unspecified by Team fractally and was therefore mathematically formalized as a function of meeting size, which is a unique contribution of this article. This phenomena was discussed in some detail and it was shown that the particular choice of combination is consequential.
We recommended that the Genesis Fractal should always choose the combination that maximizes the number of participants promoted to Round 2 since that choice benefits the mission of that particular Fractal. We also recommended that Team fractally add to their specification an additional constraint that specifies the specific combination of groups with 5 or 6 participants.
The random pairing process used by the Genesis Fractal via the breakout room feature from Zoom Video Communications, Inc. was measured to be random at greater than the 95% confidence level, and we concluded that no participants were paired with any other participant more or less than is expected from a purely random process. This result, and the techniques used to derive it, is also a unique contribution of this article.
Random processes in Fractal Governance, if used correctly, can bring hope to the world by providing and incorruptible and trustable system of government. However, adversaries of Fractal Governance can, and probably will, try to subtly insert themselves into these random processes to trick the governed and sow anxiety and mistrust, rage and hatred. This threat makes it important that Fractal Governance have robust surveillance and monitoring systems in place to constantly test their random processes for purity.
Postscript
The author uses the book More Equal Animals and the anime series Puella Magi Madoka Magica to teach the principles and concepts of Fractal Governance to others. The book outlines the principles within a historical context while the anime portrays the perils of relinquishing one's independence to the System.
Figure 6 shows the protagonist reliving the same month over and over again searching for the one path that will save her from a destiny of tragedy, destruction and despair after having entered into a contract with the System.
 |
|---|
| Figure 6 |
Updates
| Date | Description |
|---|---|
| 2022.09.21 | Two spelling errors were corrected by replacing "chose" with "choose" and "where" with "were". Two grammatical errors were corrected by replacing "solution" with "solution to Equation 1" and "choice to Equation 1" with "choice of solution to Equation 1". Figure 6 was slightly cropped to accommodate rendering the entire image. |
| 2022.09.23 | One grammatical error was corrected by replacing "group of size of 5 or 6" with "group of size 5 or 6". |
Awesome! Thank you for the research!
Great analysis, Matt. Thank you for doing this!
Since I don't know the data as well as you, I don't think I can easily extrapolate this. But my sense is that, as the meeting size starts to climb past 50, we'll see less and less groups of 5.
Do you think that sounds right? Or wrong? Or should I quit guessing and go do some math? :)
Hi Jason,
The number of groups of size 5 actually increases linearly with increasing meeting size, as I show in Figure 1. The same is true for the number of groups of size 6, for that matter.
So it is the exact opposite of your intuition.
I created a spreadsheet in which I intentionally solved for the minimum groups of 5 for any number of participants. I found that, for group sizes 20-102, it was possible to have the percentage of people in groups of 5 decrease as the group size got larger.
I'm not sure if you and I are talking about different things, or if my math is wrong, or if I've seen something you didn't see. But I'll include the graph here, and I'll share the spreadsheet with you by email.
I'm very interested to hear your comments about this!
Ah, yeah we definitely could add it in writing somewhere, but the intention is that groups are always size 6, and we allow for groups of size 5 only when there aren't enough for a complete breakout room.
Interesting suggestion. Another benefit to meetings of 5 people that you didn't mention is that groups of 5 are psychologically more likely to be conversational & inclusive rather than dominated by one or two charismatic "leaders."
That said, it's not obvious to me that maximizing distributed respect on a given day is necessarily a benefit. Also it would change the constitution of the second meeting to being approximately the top half of the contributors in a community to being the top 60%. Also means more total man hours are required (more people need to do two rounds). These are not necessarily positive or negative, I'm just thinking of implications.
There's also other benefits to groups of size 6: consensus among 6 is 4/6 == 66%, which better approximates the BFT consensus threshold.
Anyway, I'm sure there's more to consider here.
Thanks, as always, for the thoughtful post @MattLangston.