The next step after collecting the information is the fundamental analysis, but since the fundamental analysis is primarily a study of a company and its financial health, in this publication, we will go directly to the technical analysis and especially because the purpose of this course is to learn the trading of crypto currencies.

Technical analysis is the study of the market through the use of price charts, volumes... based on historical study, psychology and the law of probability. Its objective is to predict future changes in prices
The technical analysis is subdivided into two types of analysis:
- The Graph Analysis: attempts to identify trend patterns and analyze the signals of change. It is highly subjective.
Quantitative Analysis: provides mathematical and statistical calculations in order to reduce the subjectivity so present in Graphic Analysis, using tools such as:
Oscillators:
-RSI
-Momentum
-MACD
-Stochastics
- Trend indicators:
-Moving Averages
-ADX (DMI)
-Parabolic SAR
Volatility Indicators:
-Bollinger BandsVolume and Open Interest Indicators
**The basis of the Technical Analysis has its origin in the Dow Theory:****
Charles H. Dow developed Dow's Theory in the late 19th century, focused on describing market behavior, trying to locate trends, not anticipate them. This theory is based on six basic principles:
**1) Price discounts everything:**** the game of supply and demand that the prices of any asset suffer are admittedly sufficiently collected by the average values of the latter.
2) The market has three simultaneous movements: Primary or long-term movement, which can last from one year to several years. Secondary Reactions, with a total duration from about three weeks to several months. Other movements, of very short duration that usually go from several hours to a few weeks and that are normally movements that can be controlled by market participants or investors.
3) The primary movements usually crystallize in three phases:
The accumulation phase, the most informed or active investors start to push the price up. Consolidation, when the so-called trend followers consolidate the movement. And the Distribution, coinciding with the massive participation of investors with less possibilities of information that normally also coincides with the end of the phases and with a fall in prices in an upward trend or a rise in a downward trend.
4) The different stock market indices must confirm the upward or downward trends. It is not enough just to lower the DJ (Dow Jones) Industrial Index, the Railway Index must also fall...
5) Volume confirms the trend: The trading volume should rise as the price moves in the direction of the trend and fall when the price goes against it.
6) A trend remains in effect until it shows clear signs of changing direction:
You can detect trend changes before the fundamental analysis.
It can be used for the short, medium and long term.
It can be applied to any asset that is priced and traded: stocks, bonds, commodities, currencies, cars
It is affordable to use and fast.
Advantages of using technical analysis:
You can detect trend changes before fundamental analysis.
It can be used for the short, medium and long term.
It can be applied to any asset that is priced and traded: stocks, bonds, commodities, currencies, cars
It is affordable to use and fast.
Disadvantages of using technical analysis:
It's not an exact science.
Its interpretation is subjective.
It does not consider the fundamentals.
Many figures are completed because traders follow the technical analysis.
TYPES OF CHARTS
Price charts represent historical prices and can be displayed with lines, bars or candlesticks.
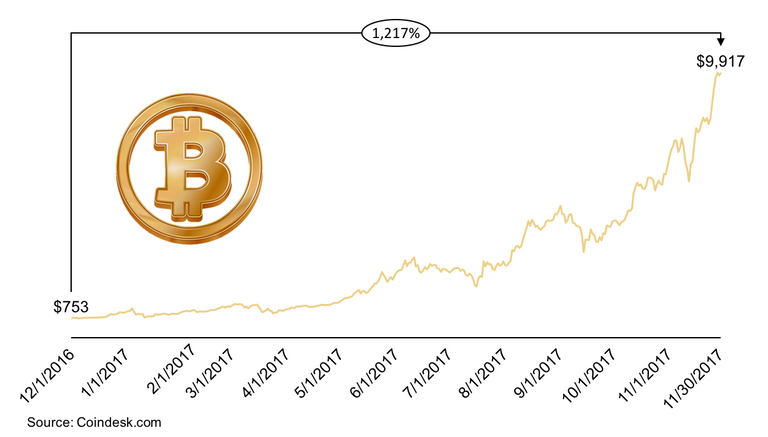
1)Line chart:
consists of a line that links the closing prices of the security in a given period of time.
2)Bar graph:
allows to identify the opening, closing, maximum and minimum price of the session. Sometimes it appears green if the price has risen during the session and red if it has fallen.

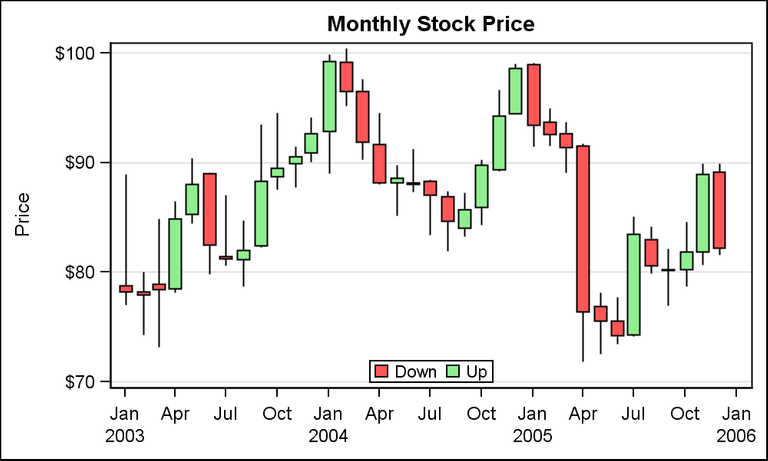
3)Candlestick chart:
Where you mark the maximum, minimum, open and close value, as well as mark the color green, if it has gone up, and red, if it has gone down.
In the next post i will explain:
- The trend
- Support and resistances
- The Major formations
I hope you enjoyed the post👍👍
See you next time and thak you for youre support👍