
The mining stocks are showing signs of weakness on this rally. Gold printed a high of 1232.7 on Fri but yet the miners closed below the previous days high. In other words they are not making new intraday highs along with gold. Gold has now confirmed that a new daily cycle has started, so it may rally for another 1-2 weeks before topping out. The miners need to show some strength soon or they are at risk of breaking down further.
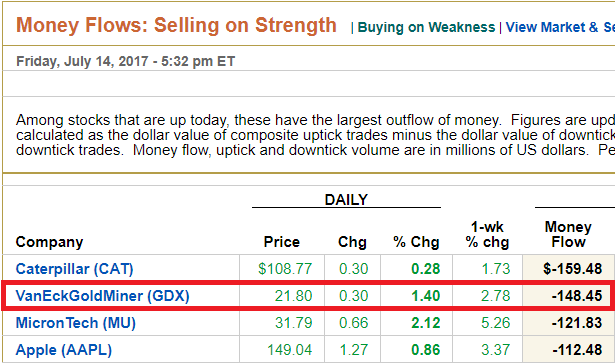
On Fri the GDX had large selling on strength (SOS). There was also SOS on Mon, Tues and Wed. So since the start of the rally, big players have been either dumping or initiating new short positions. The moneyflow is clearly negative and distribution is taking place.
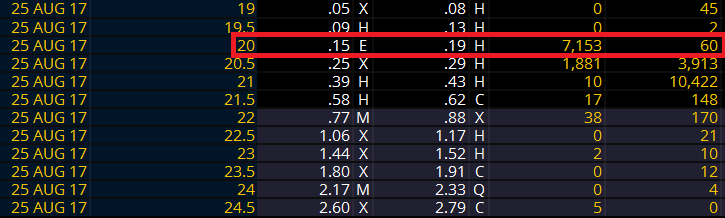
I also spotted a large bearish intermarket sweep in the options market. This was a sharp bet as the trade was made right at technical resistance at the 22 level. 7,153 25 Aug 20 puts were bought at 17c vs 60 OI. Total premium $121,601.
Also on Wed about 18,000 Sep 19 puts were bought at 19c, total premium over $340,000. So the money flow in the options market is also negative/bearish.
Outlook
By analyzing money flow we can determine if a stock is under accumulation or being distributed. If this was the start of a new upleg in the gold miners then we should be seeing positive moneyflow, not negative. I do not believe any further upside in gold will help the miners much based on their performance so far and I'm still of the view that this rally is just another dead cat bounce. If GDX drifts back down to 21 , it will be broken and selling should accelerate. My targets for GDX stands at 18.6 to lower 19s.