Hi Everyone,
In my post, Power, Money and Me Me Me, I discussed people’s desire for wealth and/or power and the connection between the two. Wealth could be desired in its own right. Some people could be content with the lifestyle that wealth could offer them. Some people also desire power but predominantly for the purpose of maintaining or securing more wealth. Some people desire power more than wealth; they use their wealth as a means for obtaining power as well as to accumulate more wealth.
Wealth could be used to obtain power directly through ownership and employment. Wealth could be used indirectly to influence people in positions of power. Wealth could even be used to create opportunities to obtain substantial power directly (e.g. political).
In my post, The Power to Own, I discussed how power is used to obtain ownership. Ownership relates to possession and control of property. Power can be used to control property. It can be used to limit or even dictate how property can be used or treated. If instructions or demands are not met, possession of property can be obtained. A wealth power cycle has been created. The longer this cycle persists the harder it is to break.
Wealth-Power Cycle

The richest have been very successful at maintaining and securing more wealth. Wealth disparity between the worlds’ richest and everyone else has been consistently widening for decades. See Figure 1 below.
Figure 1: Global Distribution of Wealth, 2021
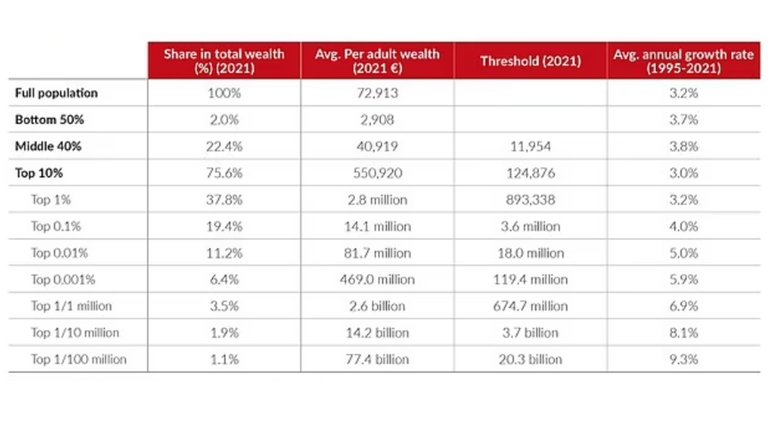
Source: Daily Mail
The wealthiest 0.01% of the world’s population hold more than 11% of global wealth. This is more than 5 times the wealth of the poorest 50%. This gap will continue to widen for as long as the growth rate of the richest exceeds the poorest. During the Covid-19 fiasco, this gap widened even more dramatically. During the final three quarters of 2020, on average, billionaire wealth increased by 27% (Visual Capitalist). See Figure 2 for gains made by the richest billionaires.
Figure 2: Increase in Billionaire Wealth during Covid-19 Fiasco in 2020
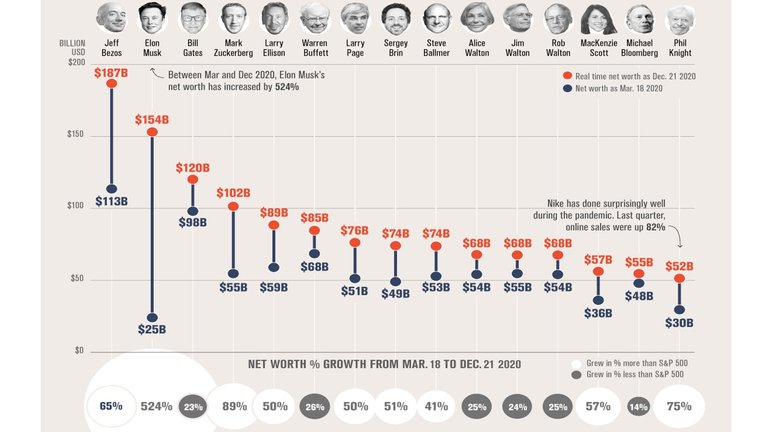
Source: Visual Capitalist
According to Credit Suisse, at the end of 2021, global wealth was estimated to be US$463.6 Trillion. In 2022, the combined wealth of the world’s billionaires was approximately US$12.7 Trillion; that is equivalent to 2.7% of global wealth. According to The Guardian, in 2022, at the time of publishing, there were only 2,688 billionaires in the world.
As of January 2023, the market cap for the 15 largest companies was equal to US$13.415 Trillion, which equates to about 2.9% of global wealth (Companies Market Cap). These companies are as follows.
Table 1: Market Cap of 15 Largest Companies in the World (January 2023)
| Rank | Company | Market Capitalisation (Trillions) |
|---|---|---|
| 1 | Apple | 2.31 |
| 2 | Saudi Aramco | 1.927 |
| 3 | Microsoft | 1.847 |
| 4 | Alphabet (Google) | 1.261 |
| 5 | Amazon | 1.043 |
| 6 | Berkshire Hathaway | 0.681 |
| 7 | Tesla | 0.562 |
| 8 | NVIDIA | 0.507 |
| 9 | Tencent | 0.502 |
| 10 | Visa | 0.49 |
| 11 | TSMC | 0.484 |
| 12 | Exxon Mobil | 0.476 |
| 13 | UnitedHealth | 0.454 |
| 14 | Johnson & Johnson | 0.434 |
| 15 | LVMH | 0.437 |
| -- | Total | 13.415 |
Source: Companies Market Cap
Using your wealth
A considerable amount of wealth has accumulated to the richest people and the largest companies in the world. However, the most significant power is derived from wealth from people outside of the rich list. This is done by Government through taxation and spending. It is done by big banks that hold people’s deposits. It is done by Central Banks through the printing of money. It is done by asset management companies that invest on behalf of their clients. In this post, I explore the extent of wealth controlled by Governments, banks, and asset management companies.
Governments

If we exclude the two World Wars, Government expenditure for western countries has trended upwards for most of the 21st century. Figure 3 contains Government expenditure to GDP ratio trends for over 100 years for several of the world’s most affluent countries. Figure 4 contains Government expenditure to GDP ratio for 2021.
Figure 3: Government Expenditure for selected countries from 1900 to 2011
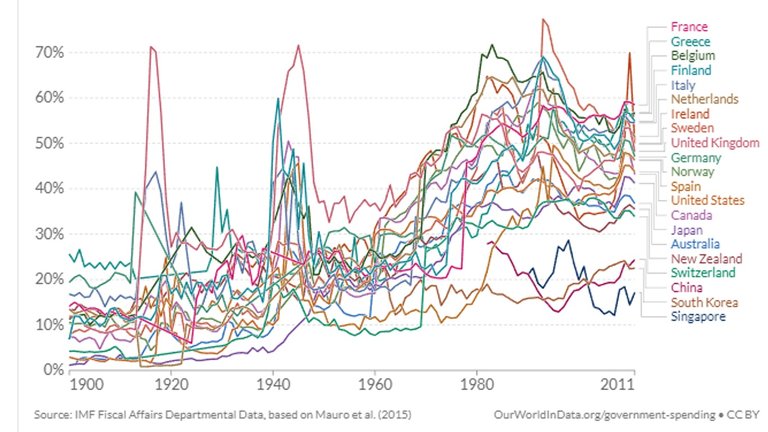
Source: Our World in Data
Figure 4: Government spending for selected countries (2021)
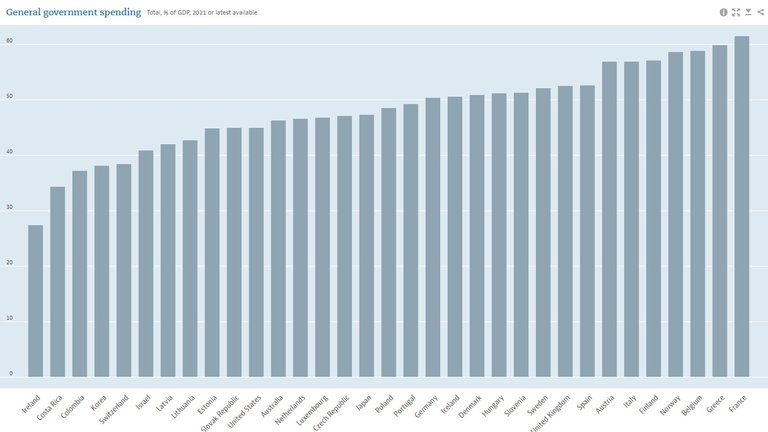
Source: OECD Data
Note: Ratios in 2021 are higher for most countries because of the Covid-19 fiasco
Government expenditure for all of the above western countries has consistently exceeded 30% of GDP. Government expenditure for several countries even consistently exceeded 50% of GDP (e.g. France, Greece, Belgium, Finland, Italy, and Netherlands). As percentage of GDP, Government expenditure has at least tripled for most countries. High Government expenditure is supported by high taxation. Tax revenue lags Government spending. Initial spikes in spending are typically funded through borrowing (e.g. high spending during the World Wars). When taxation is increased to repay debt or just the interest on debt, it remains at the higher level until another spike occurs. We can expect taxes to increase in the coming years; thereafter, remain high at this level. See Figure 5 for taxation trends over the past 100 years for a small sample of countries.
Figure 5: Tax Revenue France, Sweden, United Kingdom, and the USA (since 1900)
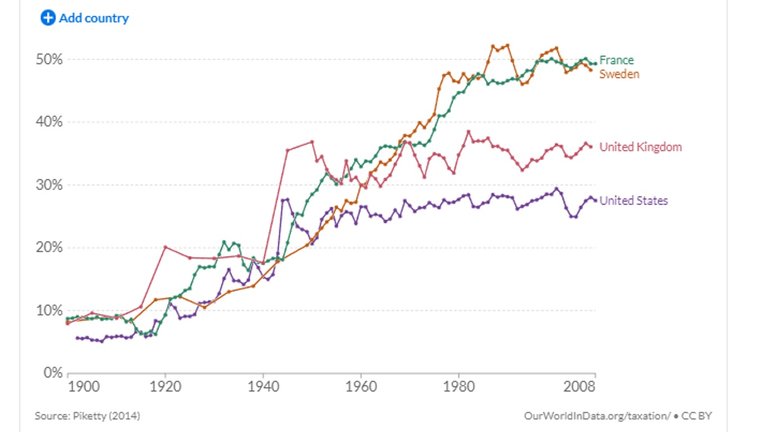
Source: Our World in Data
Note: Long-run tax revenue data not available for most countries
It may appear that Government spending has stopped increasing for most countries after the 1980s. This is only true as a percentage of GDP. GDP has been consistently increasing for almost all western countries. Therefore, Government expenditure of these countries continues to increase in gross terms. Government expenditure is also increasing in relative terms in respect to people not in the 0.01% of the wealthiest. This would become apparent in a real median wages to taxation ratio. In my post, Cost of Living Crisis – A Collection of Symptoms caused by Serious Long-term Political Failure, I discussed the stagnation of real wages in comparison to increasing productivity. Control of spending is consistently shifted towards the few.
Figures 6, 7, 8, 9 and 10 shows Government spending for USA, Euro Area (20 European Union member countries that use the Euro), the UK, China and Japan respectively from 1997 to 2022.
Figure 6: Quarterly Government Spending in the USA (USD Billion)
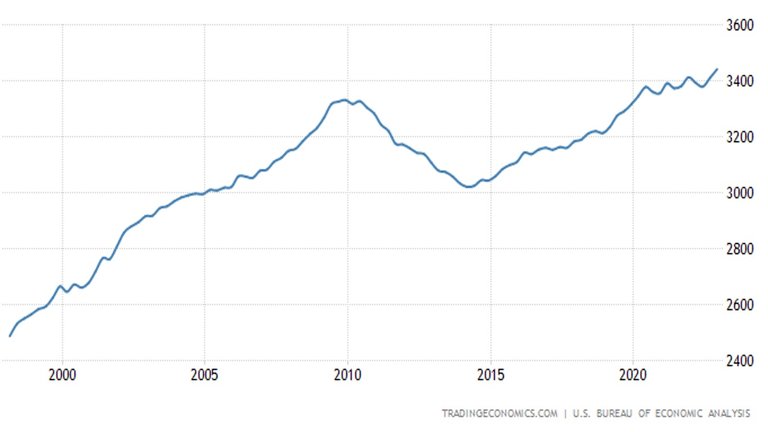
Source: Trading Economics
Note: In 2022, Government spending was equivalent to 37% of GDP
Figure 7: Quarterly Government Spending in the Euro Area (Euro Billion)
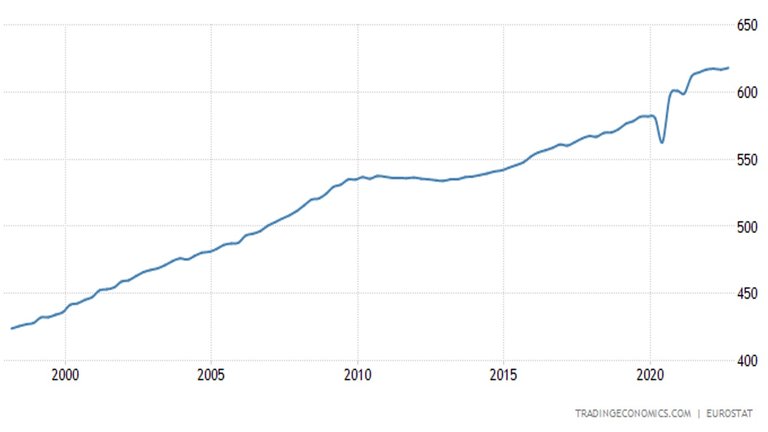
Source: Trading Economics
Note: In 2022, Government spending was equivalent to 52.4% of GDP
Figure 8: Quarterly Government Spending in the UK (GBP Million)
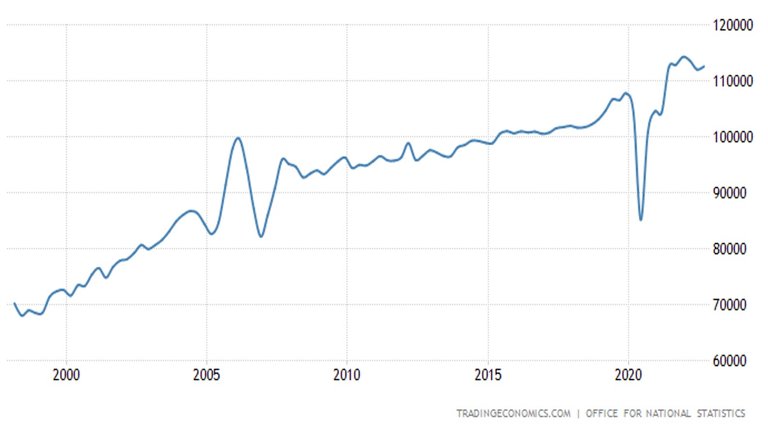
Source: Trading Economics
Note: In 2022, Government spending was equivalent to 44.7% of GDP
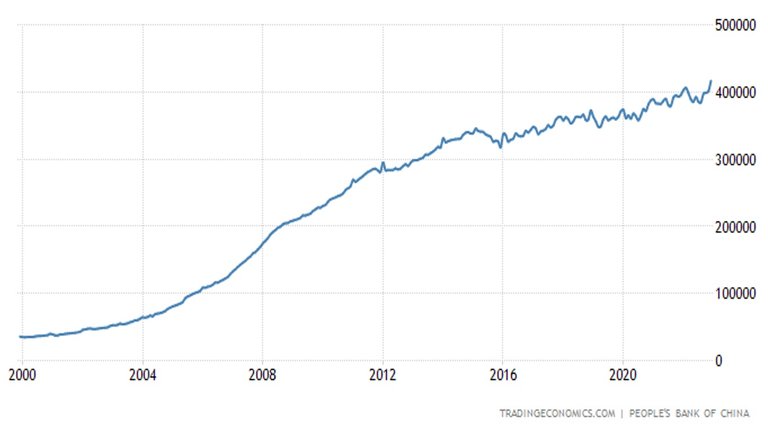
Figure 9: Annual Government Spending in China (CNY HML)

Source: Trading Economics
Note: Government spending equivalent to 15.92% of GDP (2021) (The Global Economy)
Figure 10: Quarterly Government Spending in Japan (JPY Billion)
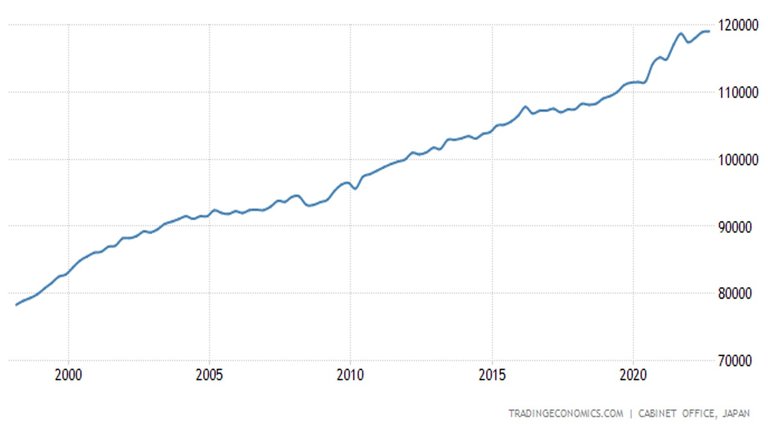
Source: Trading Economics
Note: In 2022, Government spending was equivalent to 47.3% of GDP
In 2022, Global GDP exceeded US$100 Trillion (US$104 Trillion) (Visual Capitalist). The above countries and trading bloc account for more than 2/3 of Global GDP (USA, China, and Euro Area account for almost 3/5 of global GDP). Approximately 35% of this GDP or almost 25% of global GDP is from Government spending from these countries and bloc. This is a considerable amount of influence from just a small group of people in Government. Figure 11 contains a graphic of the breakdown of global GDP.
Figure 11: World Share of GDP
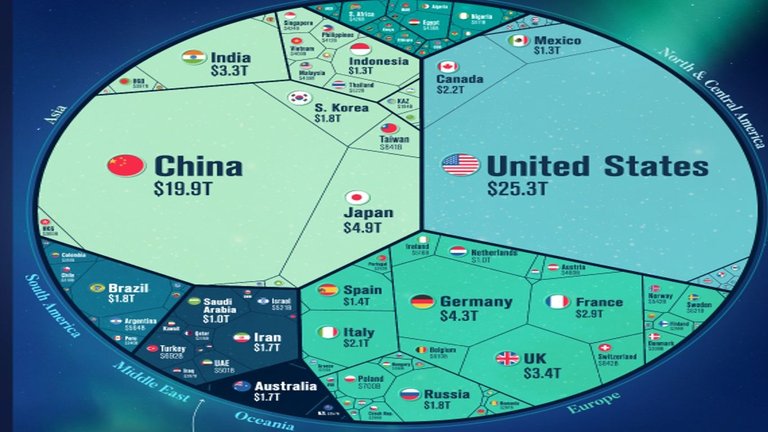
Source: Visual Capitalist
Banks

Under most circumstances, big banks are very successful. They have consistently outperformed most other businesses. This is particularly true in the USA. Figure 12 compares financial industry profits with non-financial industry profits and US nominal GDP.
Figure 12: US Financial Industry Profits (1965 to 2005)
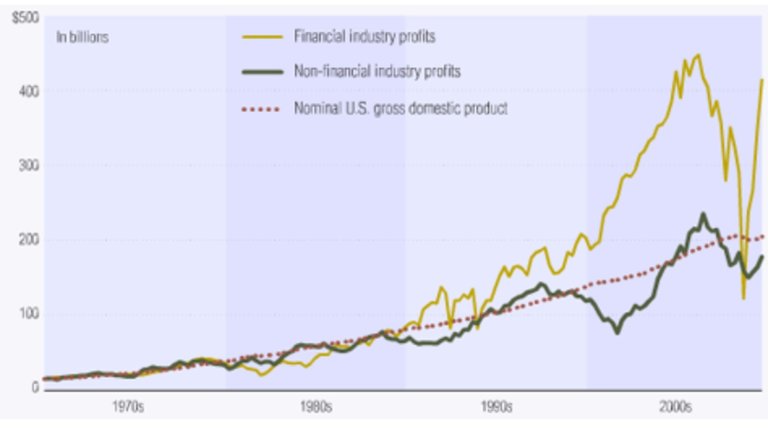
Source: Seeking Alpha
Banks profit from borrowing and lending money. Banks’ interesting rates for lending are higher than their interest rates for borrowing. Banks borrow money so they can lend it to someone else. Borrowing more money enables banks to lend more money; this enables them to earn higher profits. A major source of bank borrowings are customer’s deposits. They attract customers with security for their money, online banking services, convenience for making payments, and a small interest return (this is sometimes completely offset by fees).
Customers can obtain a higher interest rate if they are willing to commit to less liquidity (e.g. term deposit). The small number of large banks reduces competition between them. This enables them to offer very low interest for savings accounts. This also enables them to charge higher interest rates on loans. This interest rate increases with risk. A secured loan (i.e. backed by asset/s) is considered lower risk than an unsecured loan (i.e. not backed by any assets). To obtain an unsecured loan customers are required to demonstrate reliability in repaying previous loans.
Mortgages are an important flow of income for banks as well as a potential mechanism to control people with the threat of retaking property. In the USA, in 2021, the total value of mortgage debt reached US$18 Trillion (equivalent to about 80% of US GDP); this has almost tripled over twenty years. Figure 13 contains the trend in mortgage debt in the USA between 2001 and 2021.
Figure 13: Mortgage Debt in the USA (USD Trillions)
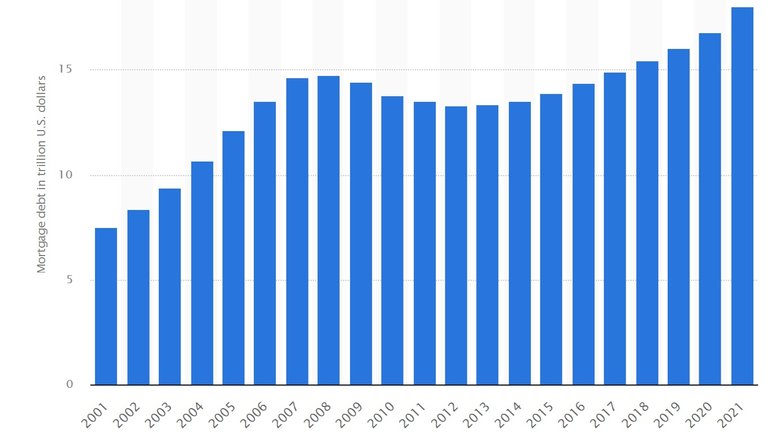
Source: Statista
Increasing profits and debt from mortgages relies on the continuous rise in the price of properties. Most western countries have done a good job in ensuring that the long-run trend for property prices continuously increases and continues to outpace median wages. I discuss mortgages in detail in my post The Mortgage Slave and video of the same title.
Banks hold a percentage of deposits to enable their customers to withdraw money; referred to as reserve ratio. This is often a small percentage of the deposits (e.g. 10%). This does not normally cause a problem for the banks as most people do not typically make large withdrawals on a regular basis. If a large number of people wanted to withdraw all their money within a short timeframe, banks would not have the available money to enable them to do so.
Banks, Government and non-financial businesses strongly encourage people to keep their money in banks. Government and businesses pay wages directly into banks. Tax is deducted directly from banks, online payments are made through the banking system, in person transactions are encouraged to be made with debit and credit cards, and prepaid cards or debit cards are used for daily travel. People are unable to obtain a job without a bank account. They are unable to receive Government payments if they do not have a bank account. During the Covid-19 fiasco, many businesses restricted or banned the use of cash on the basis of reducing contact between customers and employees.
The requirement to have a bank account and pressured dependency to use digital transactions, reduces the likelihood of mass withdrawals of cash. Therefore, giving banks greater power to use their customer’s money. In the USA, in 2020, this power was increased further when the required reserve ratio was reduced from 10% to 0% (Investopedia). In theory, banks could lend all of their customers' deposits; thus, putting no limit on lending and money circulation through lending.
If countries completely transition to digital currencies (i.e. Central Bank Digital Currencies (CBDC)), money could become locked within the financial system. Banks would not need to facilitate withdrawals as physical cash would have been made redundant. This would further increase the control banks’ have over customers’ wealth. Transactions would become purely the movement of numbers on a screen. The banks' activities would be undisturbed.
Banks have had consistently great success at attracting money from households in the form of deposits. Figure 14 shows the trends in assets held as deposits by households and non-profit organisations in US financial institutions.
Figure 14: Value of assets held by households and non-profit organizations in time and savings deposits in the USA from 2000 to 2021 (USD Trillions)
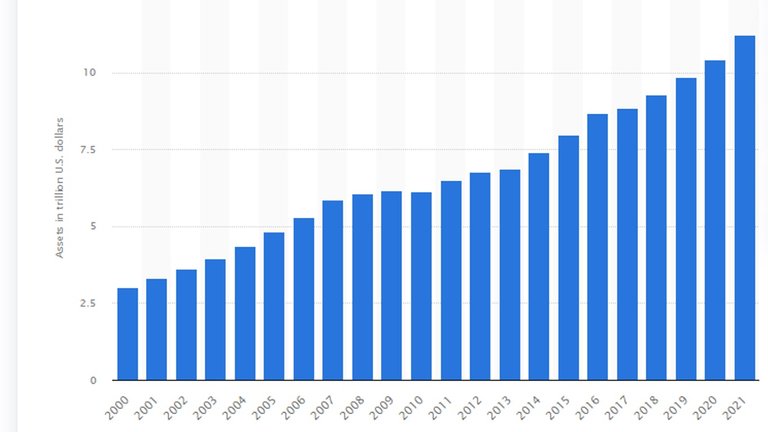
Source: Statista
Deposits have quadrupled in nominal value over these twenty years. They are equivalent to almost 50% of US GDP. Interestingly, there was no drop in value during the 2008 and 2009 financial crisis. Overall, over the past 20 years, assets held by banks have continued to grow. Figure 15 contains the combined value of USA banks’ assets from 1997 to 2022.
Figure 15: Bank Balance Sheets USA (USD Billions)
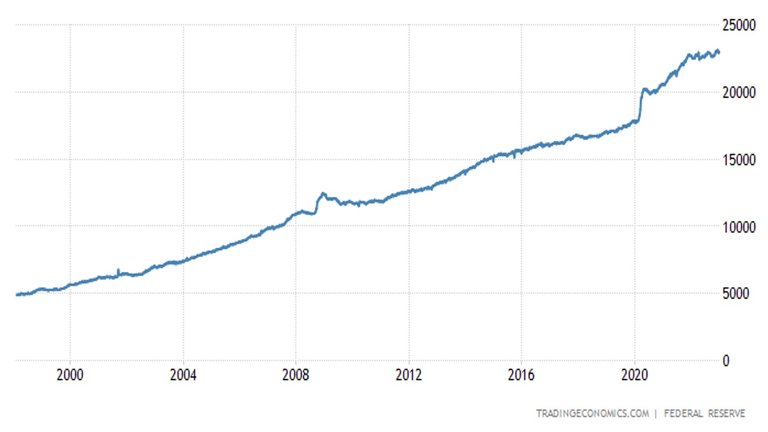
Source: Trading Economics
The value of their balance sheets have more than quadrupled over 25 years. In 2002, the value of these assets were slightly below the US GDP for the same year. The same trend is occurring in many other large western economies. Figures 16, 17, and 18 contain the aggregate bank balances for France, Germany, and the UK in their national currencies (reliable data was not available for China or the Euro Area).
Figure 16: Bank Balance Sheets France (Euro Millions)
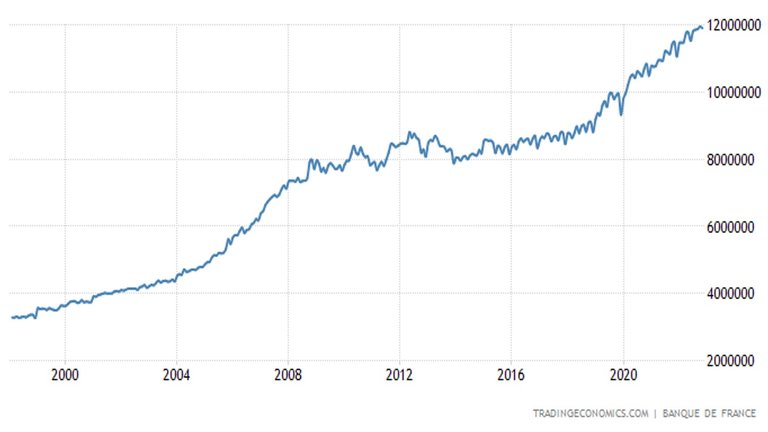
Source: Trading Economics
Figure 17: Bank Balance Sheets Germany (Euro Billions)
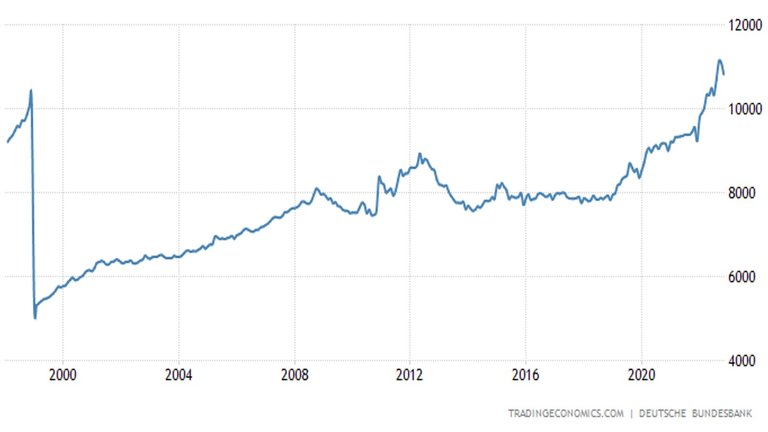
Source: Trading Economics
Figure 18: Bank Balance Sheets UK (GBP Millions)
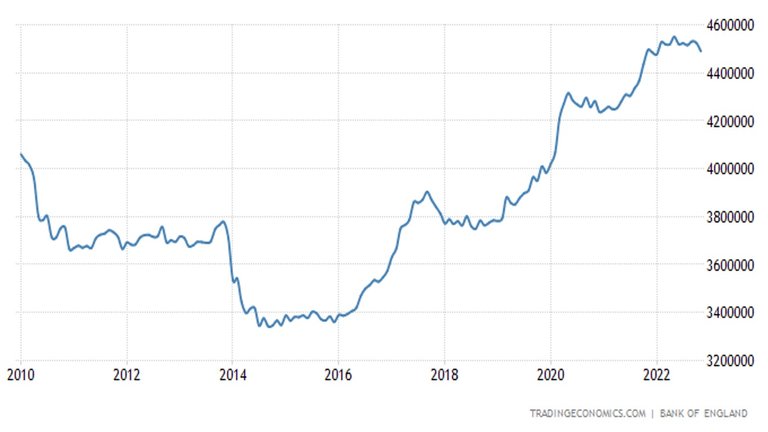
Source: Trading Economics
The biggest contributors to the recent rapid increase in assets controlled by banks are the central banks. During the Covid-19 fiasco, many central banks rapidly increased their supply of money. As central bank issued money is not backed by any assets, the creation of large volumes of money was easy (e.g. just adding some numbers to their balance sheet). This increase in money supply rapidly increased the value of the central banks’ assets in the national currencies. This has increased the power and influence banks have in general. Figures 19, 20, 21 and 22 contain the balance sheets for central banks of USA, China, Euro Area, and the UK in their national currency.
Figure 19: USA Central Bank Balance Sheet (USD Millions)
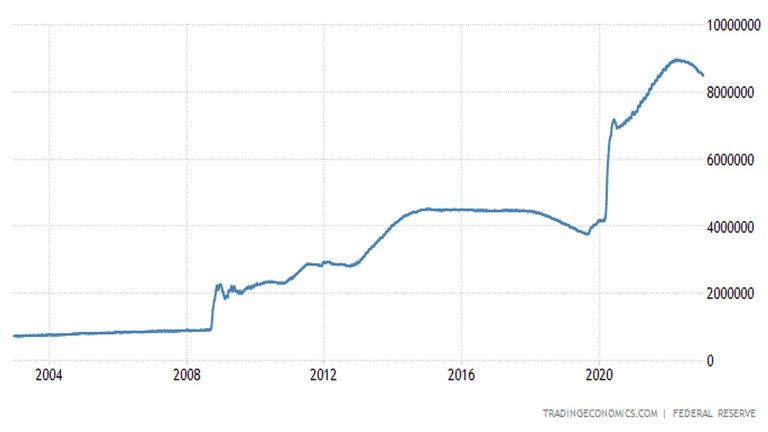
Source: Trading Economics
Figure 20: China Central Bank Balance Sheet (CNY Hundred Million)
Source: Trading Economics
Figure 21: European Central Bank Balance Sheet (Euro Millions)
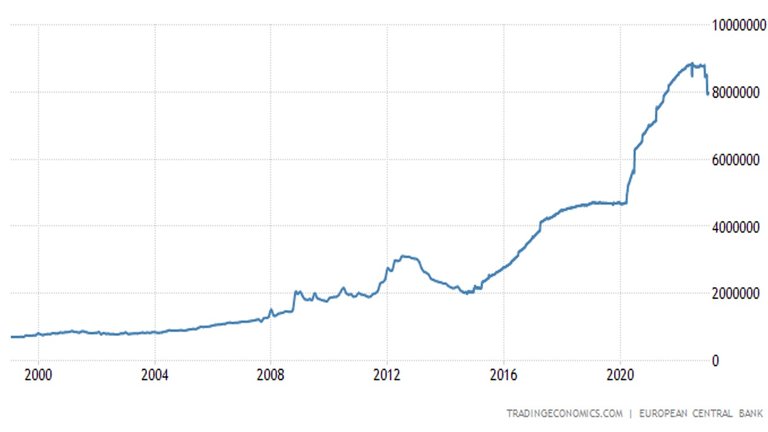
Source: Trading Economics
Figure 22: UK Central Bank Balance Sheet (GBP Millions)
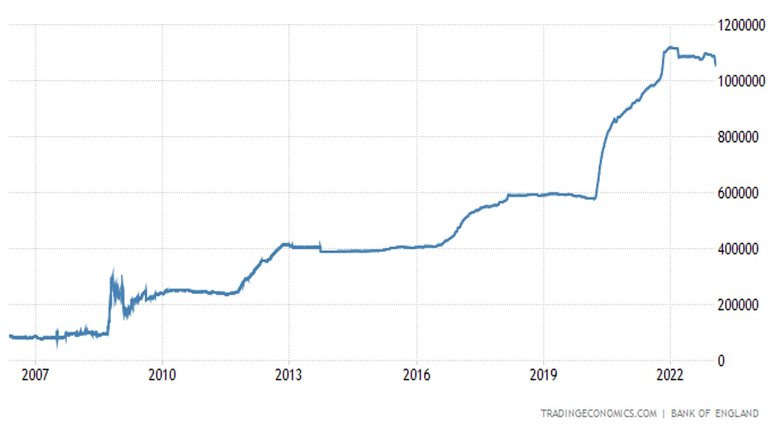
Source: Trading Economics
For the USA and the European countries, the spikes in central banks assets were very large (approximately doubling in about a year). China did not increase money supply as a response to Covid-19. However, over a 20 year period, the value of China’s central bank's assets have increased by as much as the western central banks.
The total value of banks' assets is enormous in respect to the size of economies and total global wealth. Control of assets of this value gives banks incredible influence and power over investment. This influence and power is in the hands of just a few banks and therefore just a few people. Table 2 ranks the value of assets for the 50 biggest banks in the world.
Table 2: Top 50 Banks Ranked by Total Assets
| Rank | Profile | Total Assets (Trillions) |
|---|---|---|
| 1 | Federal Reserve System | $8.822 |
| 2 | Bank of Japan | $5.879 |
| 3 | Industrial & Commercial Bank of China | $5.527 |
| 4 | People's Bank of China | $5.145 |
| 5 | China Construction Bank Corp | $4.754 |
| 6 | Agricultural Bank of China | $4.433 |
| 7 | Bank of China | $4.072 |
| 8 | Federal National Mortgage Association | $3.986 |
| 9 | JPMorgan Chase & Co | $3.744 |
| 10 | Bank of America | $3.238 |
| 11 | Mitsubishi UFJ Trust and Banking Corporation | $3.079 |
| 12 | HSBC Holdings | $2.992 |
| 13 | BNP Paribas | $2.928 |
| 14 | Social Security Trust Funds | $2.838 |
| 15 | Japan Post | $2.702 |
| 16 | Deutsche Bundesbank | $2.685 |
| 17 | Credit Agricole | $2.664 |
| 18 | Citigroup | $2.381 |
| 19 | China Development Bank | $2.362 |
| 20 | Bank of France | $2.307 |
| 21 | Federal Home Loan Mortgage Corporation | $2.204 |
| 22 | Sumitomo Mitsui Financial Group | $2.195 |
| 23 | Mizuho Financial Group | $2.042 |
| 24 | Wells Fargo | $1.960 |
| 25 | Barclays | $1.896 |
| 26 | Postal Savings Bank of China | $1.889 |
| 27 | Banco Santander | $1.807 |
| 28 | Bank of Communications | $1.766 |
| 29 | Groupe BPCE | $1.729 |
| 30 | Societe Generale | $1.614 |
| 31 | Goldman Sachs | $1.601 |
| 32 | Bank of Italy | $1.553 |
| 33 | Ping An Insurance | $1.503 |
| 34 | Deutsche Bank AG | $1.502 |
| 35 | TD Bank | $1.409 |
| 36 | Government Pension Investment Fund Japan | $1.361 |
| 37 | China Investment Corporation | $1.351 |
| 38 | Royal Bank of Canada | $1.314 |
| 39 | Bank of England | $1.292 |
| 40 | Morgan Stanley | $1.222 |
| 41 | Shanghai Pudong Development Bank | $1.218 |
| 42 | Allianz SE | $1.189 |
| 43 | ING Grope | $1.151 |
| 44 | UBS Group AG | $1.140 |
| 45 | Japan Fiscal Investment and Loan Fund | $1.137 |
| 46 | Norway Government Pension Fund Global | $1.136 |
| 47 | Bank of Spain | $1.135 |
| 48 | Intesa Sanpaolo | $1.131 |
| 49 | London Stock Exchange | $1.116 |
| 50 | Caisse des Depots | $1.112 |
| -- | Total | $121.211 |
| -- | Total for Central Banks (8) | $28.82 |
Source: SWFI
These 50 banks, control over US$121 Trillion (includes some double counting from interbank lending); this exceeds global GDP and is approximately ¼ of all global wealth. If central banks are excluded, 42 banks control about US$92 Trillion, which is slightly less than global GDP.
Asset Management Companies
The third group of businesses that use and control our wealth, which I would like to discuss are asset management companies. What are asset management companies? The following is the definition provided by Investopedia.
An asset management company (AMC) is a firm that invests pooled funds from clients, putting the capital to work through different investments including stocks, bonds, real estate, master limited partnerships, and more. Along with high-net-worth individual (HNWI) portfolios, AMCs manage hedge funds and pension plans, and—to better serve smaller investors—create pooled structures such as mutual funds, index funds, or exchange-traded funds (ETFs), which they can manage in a single centralized portfolio (Investopedia).
In short, asset management companies use their customer’s wealth to generate profit. This profit is returned to the customer minus fees. The fees are payment for the services offered by the asset management company. These companies employ people with expertise and knowledge that most people do not possess. They use these skills to analyse markets and businesses so that invested wealth produces a higher and less risky return. We (they) could argue that returns minus fees through investing with an asset management company should exceed returns from self-investment. If this argument is convincing, people will invest their wealth through the asset management company and likely re-invest their returns as well.
Some asset management companies have become very successful. BlackRock is an example of such company. Figure 23 contains BlackRock’s revenue and earnings between 2003 and 2020.
Figure 23: BlackRock’s Revenue (USD Millions) and Earnings
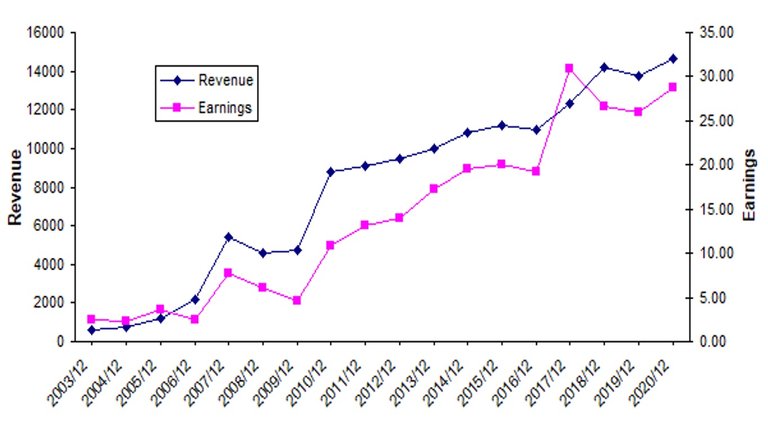
Source: Seeking Aplpha
BlackRock’s revenue has been consistently growing. According to Macroaxis, in 2022, Blackrock’s market cap exceeded US$170 Billion. This is very large but it is considerably smaller than any of the 15 largest companies listed earlier in this blog (see Table 1). BlackRock gains its power from the value of their customers’ wealth (i.e. assets under management). According to various sources such as Insider Monkey and The Balance, in 2022, BlackRock managed between US$8 Trillion to US$10 Trillion worth of assets.
In 2022, Vanguard, another asset management company, also managed over US$8 Trillion worth of assets. These two companies alone control approximately US$18 Trillion worth of assets. This is equivalent to over 70% of the US GDP in 2022. There are several other large asset management companies controlling assets worth trillions of dollars. Table 3 ranks asset management companies based on the value of assets they manage.
Table 3: Value of assets controlled by 10 Largest Asset Management Companies based on Assets under Management (AUM)
| Rank | Asset Management Companies | AUM (Trillions) |
|---|---|---|
| 1 | BlackRock, Inc. | 9.464 |
| 2 | Vanguard | 8.4 |
| 3 | UBS Group | 4.432 |
| 4 | Fidelity | 4.23 |
| 5 | State Street Global Advisors | 3.86 |
| 6 | Morgan Stanley | 3.274 |
| 7 | JPMorgan Chase | 2.996 |
| 8 | Allianz | 2.953 |
| 9 | Capital Group | 2.6 |
| 10 | Goldman Sachs | 2.372 |
| -- | Total | 44.581 |
Source: The Balance
These 10 companies control over US$44.5 Trillion worth of assets; that is equivalent to almost 10% of global wealth.
When asset management companies obtain shares with their clients’ funds, they often also obtain voting rights in these companies. Therefore, asset management companies obtain influence over these companies. Figure 24 displays Vanguard’s largest investments and Figure 25 displays BlackRock’s largest investments.
Figure 24: Vanguard’s Largest Investments (at Quarter 3 2022)
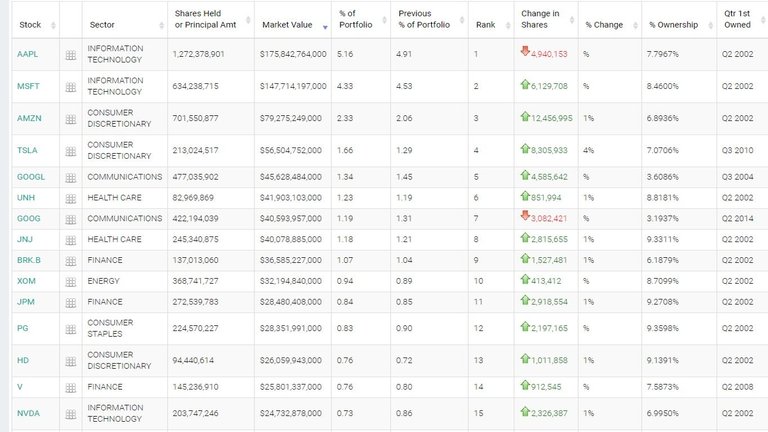
Source: Whale Wisdom
Figure 25: BlackRock’s Largest Investments (at Quarter 3 2022)
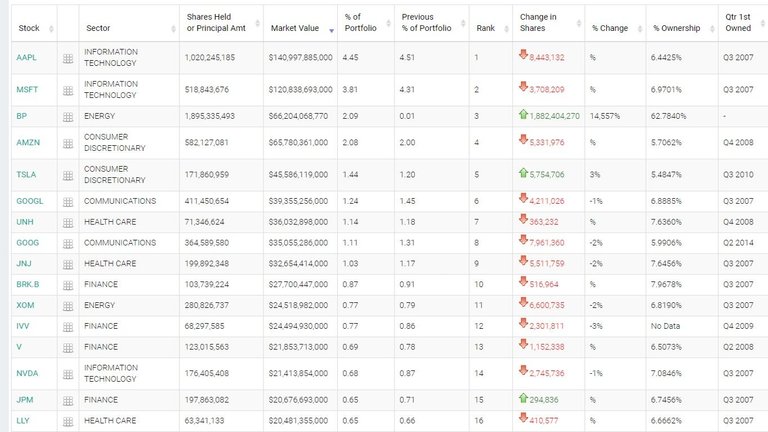
Source: Whale Wisdom
Note: sources contain a more complete list of companies that Vanguard and BlackRock have invested in.
Many of these companies are the largest companies in the world (e.g. Apple, Microsoft, Tesla, Google, Amazon, Exxon, United Health, Johnson and Johnson, and NVIDIA). These companies cover many different sectors such as information technology, health care, energy, finance, commerce, and e-commerce.
Asset management companies have the potential to influence or even determine many of the world’s largest companies’ direction and strategies while subject to minimal consequences (i.e. their clients’ wealth is at stake). If invested companies share prices fall, it is likely to affect most asset management companies as they tend to invest in the same large companies (e.g. compare BlackRock’s with Vanguard’s investments). They are likely to claim losses were caused by systemic risk.
Some of these companies are supposedly in competition with each other. However, if they are being influenced or even controlled by the same groups of people, competition is just an illusion. An article by Organic Consumers Association explains in detail how BlackRock, Vanguard, and other asset management companies have almost eliminated genuine competition in many markets.
The WEF Connection
The World Economic Forum (WEF) has become the information hub for the Great Reset, Fourth Industrial Revolution, and many other global agendas. The annual meeting is attended by world leaders, celebrities, social activists, economists and business leaders. Governments, global organisations, central banks, commercial banks, asset management companies, pharmaceutical companies, information technology companies and many others are represented at the annual meeting. Many of the invitees, partners, and sponsors contribute to WEF outputs and discussions (WEF Annual Meeting). A key focus of the WEF programs and initiatives is the centralisation of power through global bodies and organisations. These global bodies would be run by and supported by Governments and Big Business.
I discuss the Great Reset in a six part series, see posts below.
My summary and opinions regarding ‘The Great Reset’ – Part 1: Introduction
My summary and opinions regarding ‘The Great Reset’ – Part 4: Micro Reset
My summary and opinions regarding ‘The Great Reset’ – Part 5: Individual Reset
My summary and opinions regarding ‘The Great Reset’ – Part 6: Conclusion
I discuss the fourth industrial revolution and its connection to the Great Reset in my post A Peripheral look at the Great Reset and Fourth Industrial Revolution.
A key element of both the Great Reset and the proposed Fourth Industrial Revolution is ‘stakeholder capitalism’. It is a proposed replacement for ‘shareholder capitalism’, which I would argue to be a misrepresentation of free-market capitalism. Stakeholder capitalism is focused on meeting defined objectives over or in addition to profits and growth. For this to be possible, Government and businesses would need to work together. This could be through subsidies or public-private partnerships. Competition between businesses would be limited. This system would favour big businesses over small. Customers would suffer from lack of competition. Prices would be higher. The variety of products would be reduced. Higher costs would be subsidised with higher taxes. I discuss ‘stakeholder capitalism’ in detail in my post The Attempted Rebirth of Stakeholder Capitalism.
BlackRock is a WEF strategic partner (World Economic Forum). The Chairman and CEO of BlackRock is on the WEF Board of Trustees. Most of the other large asset management companies are either WEF strategic partners (UBS, Morgan Stanley, JPMorgan Chase, Allianz, and Goldman Sachs) or WEF partners (Fidelity and State Street). In 2022, BlackRock CEO, Larry Fink, wrote a letter to the CEOs of the companies BlackRock had invested their clients’ funds in. In this letter, he promotes 'stakeholder capitalism'. He encourages these companies to pursue economic, social, and governance (ESG) strategies (i.e. to align with objectives outlined in the WEF Stakeholder Capitalism White Paper). In the letter, he implied such approaches were necessary to retain funding from BlackRock’s clients (BlackRock).
The other asset management companies that partner WEF are making similar pledges to work towards goals outlined by the WEF. UBS are promoting sustainability, reducing carbon emissions, and promoting digital technology (WEF). Morgan Stanley are promoting combating climate change (WEF). JPMorgan Chase are promoting the Paris Agreement (climate action) and cryptocurrency (WEF). State Street are promoting decarbonising, cryptocurrency regulation, and stakeholder capitalism (WEF). Fidelity are promoting stakeholder capitalism (WEF). Vanguard is not a WEF partner but they are making pledges along similar lines (Gibson Dunn); thus, indicating that they would not oppose pressure placed on companies to comply with WEF goals.
For more information about BlackRock, the following articles provide useful insight into their activities.
How BlackRock Conquered the World — Part 1: A Brief History of BlackRock
How BlackRock Conquered the World — Part 3: Aladdin’s Genie and the Future of the World
How Blackrock Investment Fund Triggered the Global Energy Crisis
Global Debt
Governments, banks, and asset management companies use other people’s wealth to increase their own wealth and obtain more power. A very clear and broad example of the use and extent of the use of other people’s wealth is global debt. See Figure 26 for the increase in global debt from 2015 to end of 2021.
Figure 26: Global Debt 2015 to 2021

Source: Reuters
At the beginning of 2022, global debt had reached US$303 Trillion. It is more than three times higher than global GDP and is almost 2/3 of global wealth. Global debt consists of Government, business, and household debt. Governments and large businesses often accumulate debt through the issue of bonds. Figure 25 displays the global bond market as of August 2020.
Figure 27: Global Bond Markets (Outstanding $128.3 Trillion)
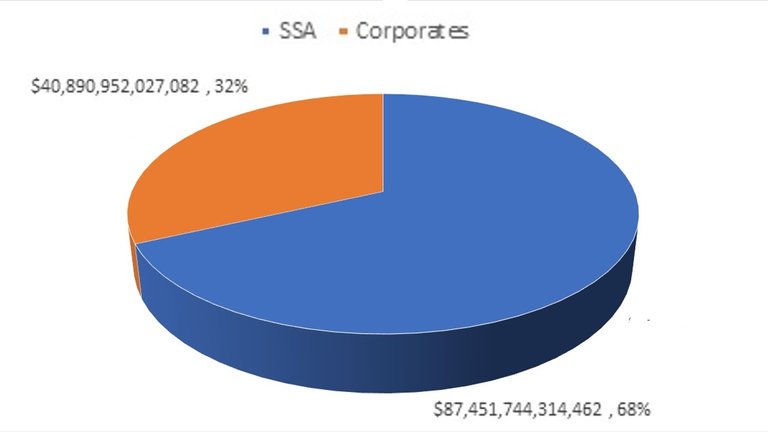
Source: ICMA Group
Bonds have maturity dates (e.g. 10 years). When these dates are reached, Governments or businesses are required to repay the bonds. In reality, this is not happening with every bond issued. Central Banks are buying the bonds off people and businesses who bought them from Government. They buy them by creating money out of nothing (i.e. adding more numbers to their balance sheet). Governments can issue more bonds; these bonds are bought by people and businesses (often banks using customers deposits), possibly with the money received from the Central Bank. This causes bond markets and debt to continue to grow. On occasions, Central Banks even buy corporate bonds (CNBC). In a roundabout way, Central Banks are lending money (they created out of nothing) to the issuers of bonds.
Increased money supply adds inflationary pressure but often does not cause inflation. Economies, through increased efficiency and productivity, are naturally deflationary. Therefore the increase in money supply prevents deflation. The responses to Covid-19 and the sanctions on Russia has greatly affected the supply side of the economy; thus, the increased money now adds to inflation. Regardless of the impact increased money supply has on inflation. The methods used to increase money supply is a transfer of wealth to Governments and often big business. Everybody else who has contributed to increased productivity miss out on an increase in real wages, which would have occurred because of deflation. Money supply could have been increased to eliminate inflation and been transferred to employees as nominal wage increases to align with increased productivity. Figure 28 shows the relationship between real wages and productivity in the USA since 1950.
Figure 28: Productivity Growth and Hourly Compensation in the USA (1950 to 2020)
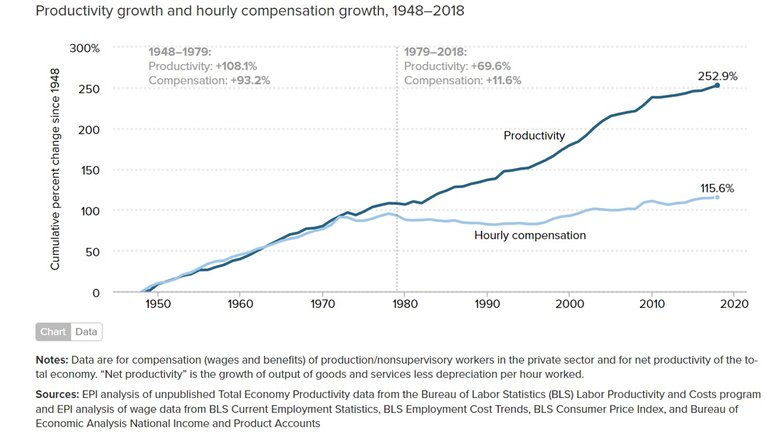
Source: Economic Policy Institute
In my post, Cost of Living Crisis – A Collection of Symptoms caused by Serious Long-term Political Failure, I discuss the divergence of wage compensation from productivity.
My Opinions

We live in a world where power and wealth is controlled by a few people and organisations. In western countries, this control has been orchestrated in a manner that has consistently deceived the majority of people. They believe they run their own country through the election of people who represent them. They believe these people are acting in their best interests; if they do not, they believe they can be voted out and replaced with people who do. They believe the property they buy is 100% their own. They believe the money in their bank accounts will always be at their disposal. They believe businesses compete to offer them the products they want. They believe the pay they receive and the hours they work are representative of the output they produce.
In reality, our freedom and our wealth is mostly an illusion. The political and economic systems are designed to benefit the few. This is mostly achieved using our own wealth and assets against us. As our dependency on the systems grow, so does the extent of control on our wealth. This control leads to the transfer of power to the few along with the gradual complete transfer of wealth.
We can regain control of our wealth by withdrawing as much as we can from the banking and financial systems. This can be done through acquiring cryptocurrencies on decentralised blockchains. They can be stored in our own wallets (not on exchanges), staked or delegated to obtain returns. In my post, Hive – How decentralised are we?, I discuss decentralisation in the context of Hive.
More posts

If you want to read any of my other posts, you can click on the links below. These links will lead you to posts containing my collection of works. These 'Collection of Works' posts have been updated to contain links to the Hive versions of my posts.


Hive: Future of Social Media

Spectrumecons on the Hive blockchain

Have you looked into counter-economics already by SEK3?
We can eliminate our dependency on the State. Render them obsolete.
Find our inner strengths again and regain our self-sovereignty. ❤️
I don't know that much about it. I will take a look into them. Always good to explore new ideas.
I'm not a finance student neither do I even have lot of idea about it but then, I must admit that reading this mind blowing publication have really impact my knowledge and all I can say is; thanks for exposing this to our knowledge
Posted Using LeoFinance Beta
No problem. The extent of control that these organisations have is mind blowing. What's even more concerning is that their control is continuously increasing. I should make a comparison in a few years time.
wealth and power really walk hand in hand, you can use one to get the other and once you obtain one, it is very easy to get the other, more reason why the wealthy always from group among themselves to secure more wealth and connection
Posted Using LeoFinance Beta
It is a difficult relationship to break and as more wealth and power accumulate to the few the harder it gets. On a positive note, more people are realising that this problem exists. Power is lost if people no longer recognise it.
Holy Moly!! What a mashup. Awesome.
I really need to accelerate my efforts to starve the beast :-)
Posted Using LeoFinance Beta
Sure, Hive can make that happen.
In so many ways, modern man is milked by the modern ruling class much harder than any medieval serf ever was.
Posted Using LeoFinance Beta
They have just found better ways to cover it up.
Exactly! That's why we work so hard for them. They've fooled us into thinking we are working for ourselves.
Posted Using LeoFinance Beta
Overall, wealth and power are intertwined and both are desired for various reasons. Some people want wealth for the comfort it provides, others for the power and influence it brings, and some for both. Ultimately, how one views and utilizes wealth can determine how much power and influence they can attain.
Wealth and control over wealth plays a huge role in obtaining power of some sort. The people running the organisations I discussed in this post control wealth but do not necessarily have a permanent relationship with it. Politicians do not last long and can be removed from power. The same can be said for CEOs. The strength appears to be in the structures they have built. Governments have become permanent but the people running have not. The same can be said about banks and possibly asset management companies.
The rewards earned on this comment will go directly to the people( @spectrumecons ) sharing the post on Twitter as long as they are registered with @poshtoken. Sign up at https://hiveposh.com.