In this post, we take a look at, How to Create Violin Plot in Python using Matplotlib. Previously we looked at the stacked bar chart in Python. You may want to follow that tutorial if you have missed it last week. There is also video on my channel playlist which you can check out. It's one of the easier tutorial and you would experiment with variety of the configs later. So check out the tutorial and now let's come back to violin plot.
Violin plot got the name for the plot due to the nature of that plot. And the way plot works you may verify that easily as well. I have realized that a lot of poeple who want to code they should check out this chart and also make sure to build their own setup on either cloud or the desktop for python, jupyter and the libraries. So I will be giving the library setup instructions too. So make sure to check that part out as well.
You can make use of the VPS and the python setup so that you can install coder, vscode server or even use services like gitpod and the codeanywhere. This way you would be able to install and setup the libraries and also make use of the code explained here. You can also set everything up on your own desktop. So this way you don't have to pay for the external servers and the services. I'd recommend the local approach that works most of the time.
And I have created a video to give you an overview on How to Create Violin Plot in Python. You should give this one a try.
First step is checking whether you have the Python installed.
python --version
Next step is making sure the libraries are meant to be installed into the desktop. We have to make the violin plot so the libraries that we would be needing are added here for the usage.
pip install numpy, jupyter matplotlib
Now let's take a look at the code we need for referencing the libraries.
import numpy as np
import matplotlib.pyplot as plt
Now let's add the code for the seed and the data there. From here we would be adding the code for plotting the chart.
import numpy as np
import matplotlib.pyplot as plt
np.random.seed(5)
x = np.random.normal(0, 2, 100)
fig, ax = plt.subplots()
ax.violinplot(x)
plt.show()
Let me give you the visual image of the code. So that you can save it for the references.

Now next step is to execute our code. And I am assuming that you are making the code in a file called say like example.py. And you wish to execute this code through thefile that would show you the output.
python example.py
You can now see the above code being executed and shows the output below.
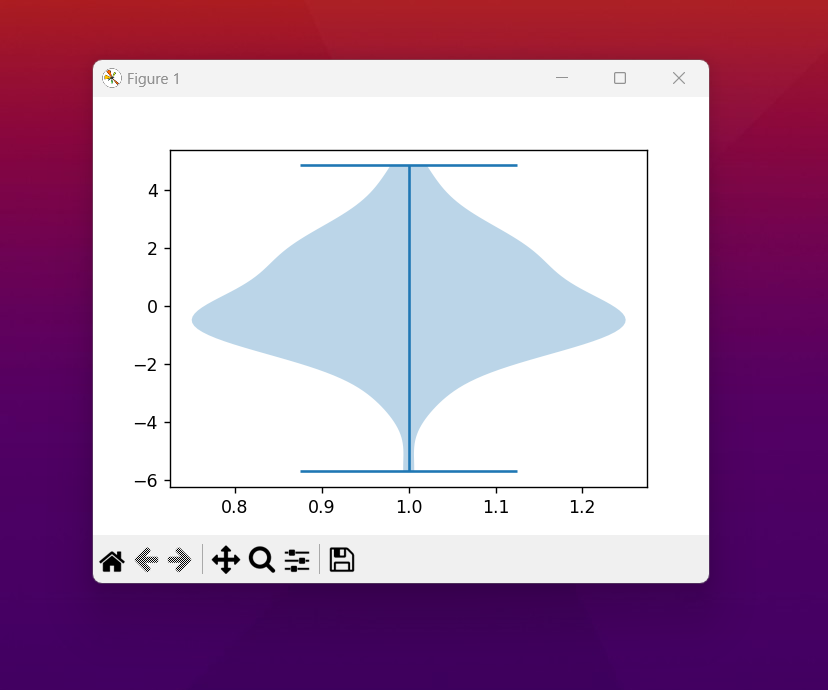
As you can see from the image here, you have the violin plot. And that's it for the simple way to draw the plot and the code is pretty simple. I have realized that some of the really good ways you can get the plot and also get to change varieety of it's properties. That includes the color, border, plot design and also variety of the other things based on the change in the data. It's a good exploration that you can do as you explore the violin plot.
Another thing is that you can also invert the plot. You can make it vertical and the horizontal chart that you can explore there. The extrema can be something we can manage there and also the thing is that fill and border color can be changed and adjusted as you require. Some of that would be pretty cool for those who want to build on the simple data and plot a better chart. I'd recommend making some experiments with median and mean value too. It's a good to explore more of those values along the way.
I have few more tutorials left then I would be covering many other code and the setup type of the tutorials from now on. I have been burned out but I have scheduled the videos and hopefully that would keep me busy for few more years and also it would be earn me good income. I guess I have to also get back to some of the code side along with the database side so that more years worth of content can be done and stored.
You can subscribe, share and like my content. This way it would help me grow on the youtube. And also commenting there would help me learn some of the issues with the content. Overall I feel that the youtube investment would make sense for me there. I just need help from others which would help me bring things much easier with the content there and hoping that it can be a good to get help from people on hive.
If you happen to like this content, do give me feedback over there and that would help me improve my efforts in near future.
Congratulations @devpress! You have completed the following achievement on the Hive blockchain And have been rewarded with New badge(s)
Your next target is to reach 500 posts.
You can view your badges on your board and compare yourself to others in the Ranking
If you no longer want to receive notifications, reply to this comment with the word
STOPTo support your work, I also upvoted your post!
Check out our last posts:
Thanks for your contribution to the STEMsocial community. Feel free to join us on discord to get to know the rest of us!
Please consider delegating to the @stemsocial account (85% of the curation rewards are returned).
You may also include @stemsocial as a beneficiary of the rewards of this post to get a stronger support.