In this post, we take a look at How to Create Circular Dendrogram in R. This type of the data visualization is useful for some of the data that is specific in terms of the percentage and the specific content that is being collected in the dataset.
For example, say you have data of population where certain numbers are there for some specific community, professions, items etc. So for that sort of the visualization you can use the dendrogram and there is also circular dendrogram in R. You can use the geographic maps for the visualization in R. I have covered that in the past - how to create geographic maps in R.
Make sure to use the RStudio for drawing the visualization. This can be lot easier with the RStudio. As there are some of the other tools too. But for me RStudio just works out. I suppose you can also try out other tools like data science tools from the jetbrains.
I have created a video to give you an overview on How to Create Circular Dendrogram in R. You should give this one a try.
Let's start.
You can check the following libraries and the dataset for installation before we can draw the map.
install.packages("dendextend")
install.packages("circlize")
After installing the same you can add into the library.
library(dendextend)
library(circlize)
Let's also think of the dataset which can be used for the visualization. USArrests is the dataset which is being used for the plotting.
data(USArrests)
d <- dist(USArrests)
We create the distance matrix of this dataset. After this we try to create hierarchical dendrogram then this type of the data.
hc <- as.dendrogram(hclust(d))
Now finally we are going to be making use of the circular dendrogram in R.
circlize_dendrogram(hc,
labels_track_height = NA,
dend_track_height = 0.5)
Now you can take a look at the plot.
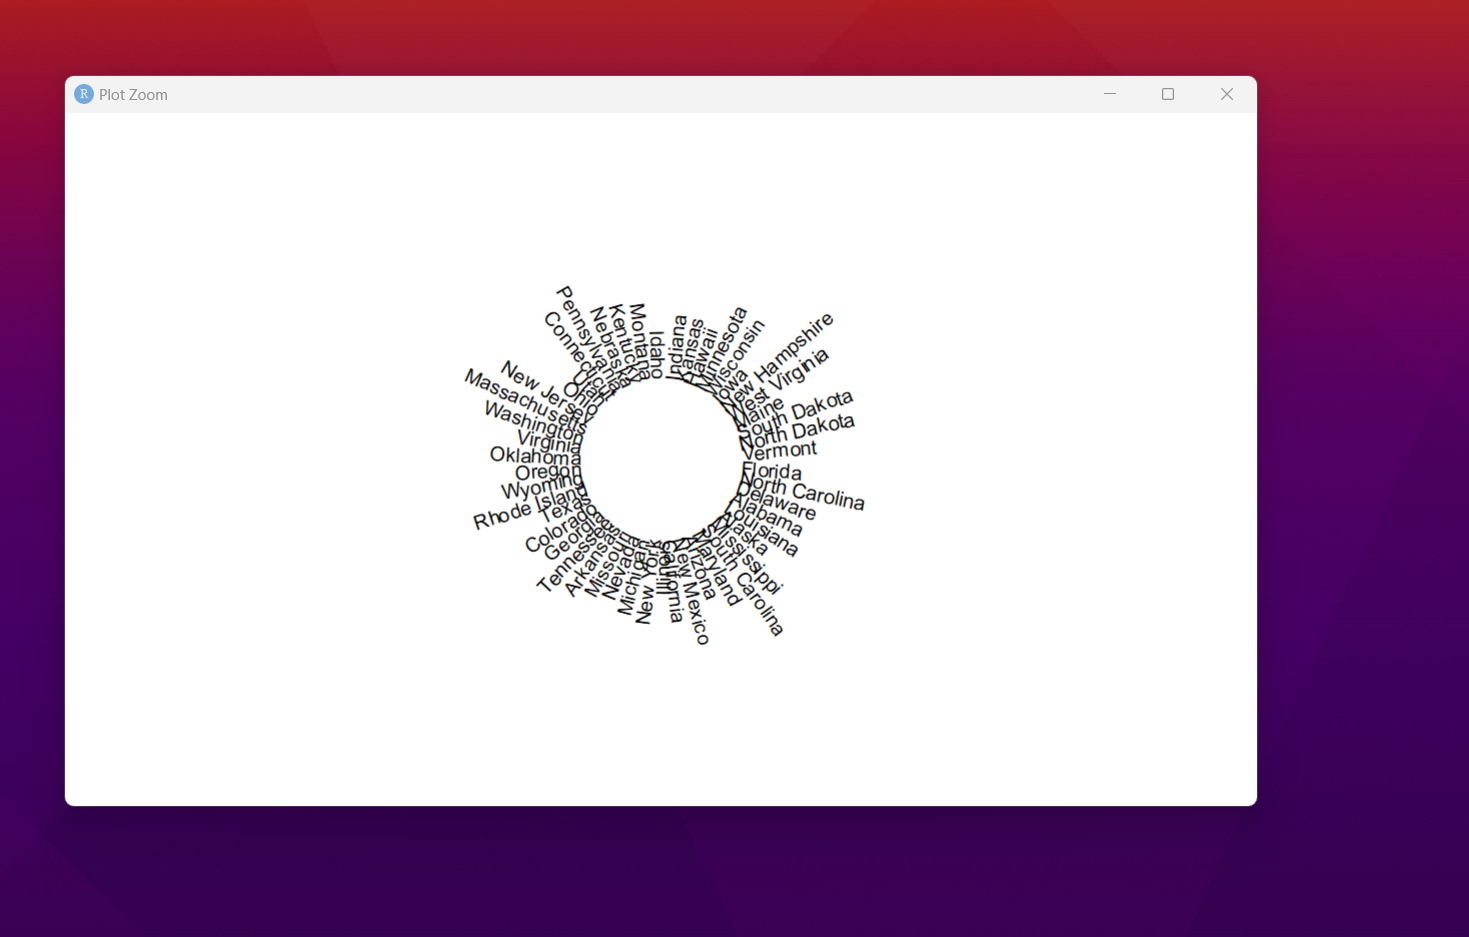
You would notice the plot which is circular dendrogram. This would be a good for most of the simple dataset where the population and strong datapoints are to be shown in fancy way.
As you can see variety of the interesting data set can be plotted like this. Anything where you have data to be presented using the donut or say some of the circular donut type of the plot. You can make use of the dendrogram for the same. It can give you an idea on the plot and the data too. So that would give you some ideas there.
If you are comfortable, do through some of the tutorials I posted in the education tribe on Hive. I have done a lot of data science specific content. And also the content that you can see with the data science content you can even test it out with the variety of options too. So it's a good option for you to work with there.
I'd recommend you to also let me know your thoughts on my video content. I have the community tab on the channel where you can also post. Most of the time I get the requests for the content from that page. And it does work out for me. It's one of the ways I can get the data sources for my content there, so it's a nice source of feedback.
I have started with the Power BI tutorials. And those tutorials are being posted on the channel. So if you are aware of the variety of the content in the Power BI content and also for the tutorial you can make use of the same in the content. You can also do the tutorials to get an idea on how to use the tool. Overall I'd say that it's a good playlist track worth going through.
You can support my youtube channel by sharing the video. You can also send it through the Whatsapp, facebok and other sources. This would help me a lot to sustain my channel. Some of the sources like that helps me in terms of the support. It's kind of hard but it's something I want to hold for sustainable income with it.
If you happen to like this content, do give me feedback over there and that would help me improve my efforts in near future.
Thanks for your contribution to the STEMsocial community. Feel free to join us on discord to get to know the rest of us!
Please consider delegating to the @stemsocial account (85% of the curation rewards are returned).
You may also include @stemsocial as a beneficiary of the rewards of this post to get a stronger support.