In this post, we look at How to Use Curve Function in R language. Previously we looked at how to create the donut chart in R. And we also learned how to make use of the Pie3D chart. Some of these charts would make it easier for you to draw things using the curve function in R.
Previously like I said covered the Donut Chart in R. Now moving onto another part is the data that we practically use in the scenarios specific to the curve function. I'd say that R language makes things easier with plotting the donut chart even with it's own base functions.
I am using the RStudio from the Posit for this type of the work. And it has served me well. It is also easy to use and make the designs into the code. So for those who are planning on making the design and the code is being done properly you can use the Curve function in R for this.
Let's take a look at the new curve function in this tutorial. And I have created a video to give you an overview on How to Use Curve Function in R. You should give this one a try.
Let's take a look at the code that you can use in this case.
First we create a function named demo. Then we try to plot some of the things using the same.
demo <- function(x) {
sin(sqrt(x ^ 2))
}
Now what we can do is go ahead for plotting those things.
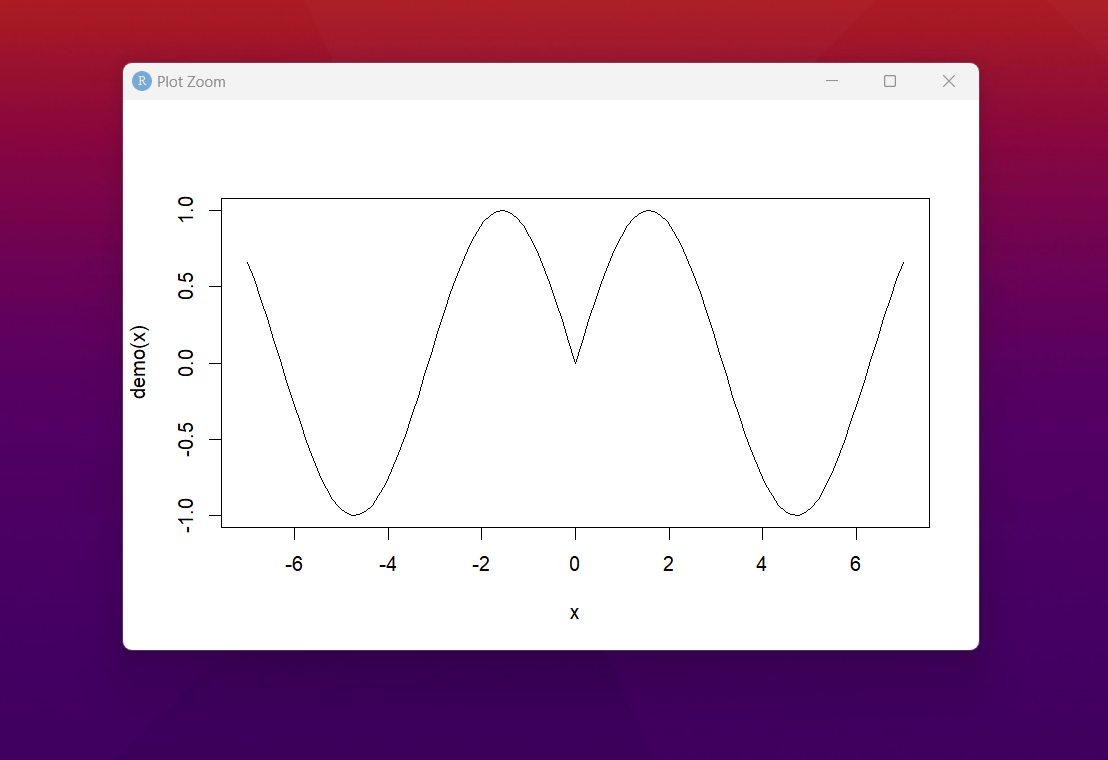
curve(demo, from = -7, to = 7)
You can take a look at the chart here. This should give you an idea over.
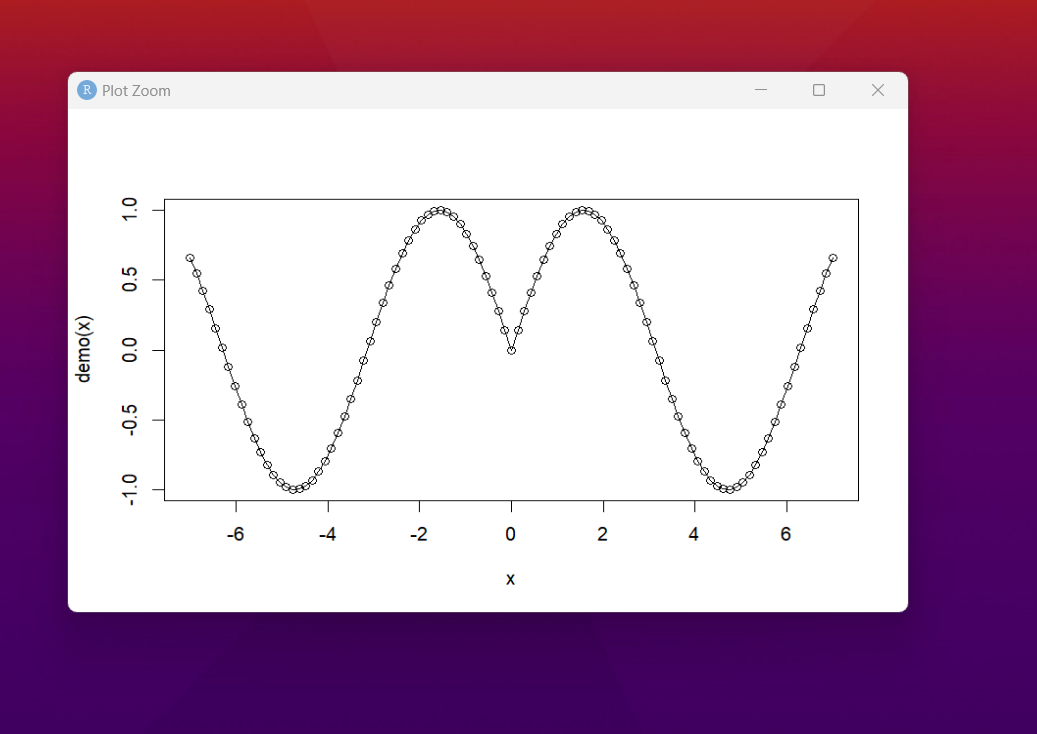
Now things won't stop here we can also draw another chart with the curve function where we make use of the dots and the lines.
demo <- function(x) {
sin(sqrt(x ^ 2))
}
Now let's plot the curve function.
curve(demo, from = -7, to = 7,
type = "o")
So now the plot would be something like this.
That's it. You can make use of variety of customization that would help you draw the curve function out. You can customize and use it with variety of data set of your own. Some of those data set can be a good option for plotting. Some of them would be custom for each dataset and the output would show up.
I'd recommend you to experiment with the data that you have. Some of the data can be pretty easier to plot there. I'd also say that you can go ahead with the kaggle data sets and see if you can simply plot them over. I don't have to be specific with dataset as this is pretty simple chart and also easy to plot with as well.
I have decided to continue the tutorials here with the charts that you can see. You may also find that the chart is pretty clear to draw. I have covered them in my videos but not a lot of traffic. So need to find out what type of the tutorials are going to bring me some value and the monetization is worth it.
So if you happen to like the data visualization and the data science based charts and the tutorials. You should be making use of the channel like mine. I know I have done a lot of experiments and there does not seem to be much takers so I have to ask you to please like, share and subscribe the content. This would be a good help for me.
If you happen to like this content, do give me feedback over there and that would help me improve my efforts in near future.
Thanks for your contribution to the STEMsocial community. Feel free to join us on discord to get to know the rest of us!
Please consider delegating to the @stemsocial account (85% of the curation rewards are returned).
You may also include @stemsocial as a beneficiary of the rewards of this post to get a stronger support.