Bitcoin Weekly Symmetrical Triangle
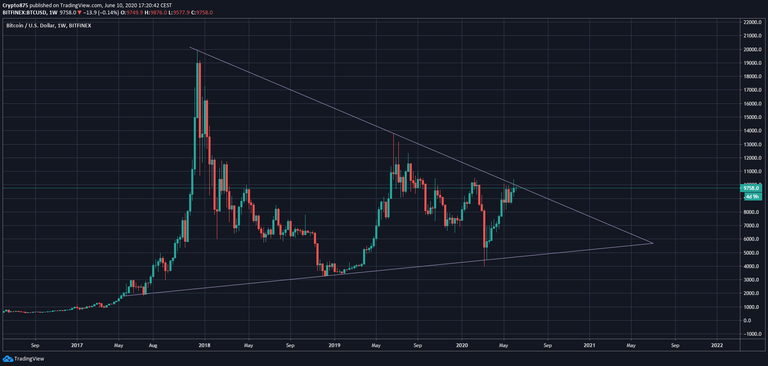
As we can see on the chart above, the Bitcoin chart on the weekly timeframe manifested this triangle of support and resistance trendlines since the huge bullrun in 2017.
Last week Bitcoin was rejected once again by the descending trendline, if the bulls don`t manage to take over, the price of Bitcoin could test the bottom of the triangle once again.
Lets see if this will play out maybe we will have a nice discount again before the next major bullrun ;)
Thanks for reading, feel free to share ur opinion in the comments. :)