Hi friends hope you are well and welcome to the new update on Litecoin. The LTC coin is again at the support of the channel therefore in today’s post we will try to see whether it will break down the support or not and what the price action can do next.
Harmonic moves with consistency and continuity:
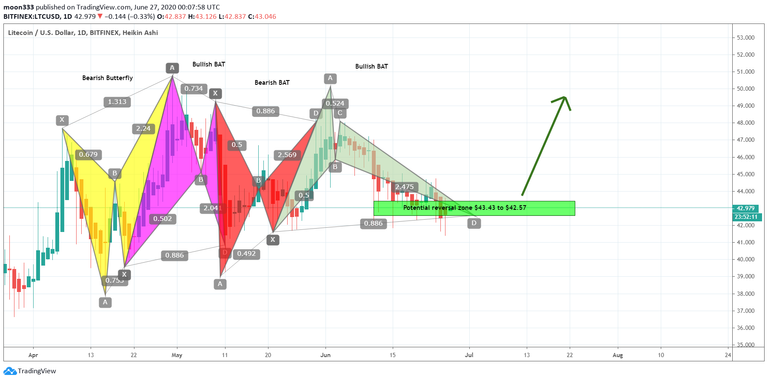
In my previous article we have seen that on the daily chart the priceline of Litecoin Is forming different harmonic patterns with consistency and continuity. 1st the price action formed a bearish Butterfly then the priceline of LTC formed a bullish BAT and after the completion of this bullish BAT the price action fromed another bearish BAT pattern and now the price action has again formed another bullish BAT pattern. At the moment the priceline is moving in the potential reversal zone since 11 June 2020. But we should set the potential reversal zone as our stop loss strictly because if the PRZ level will be broken down then the price action can move more down to form bulish Crab pattern.
The support of all SMAs are broken down:
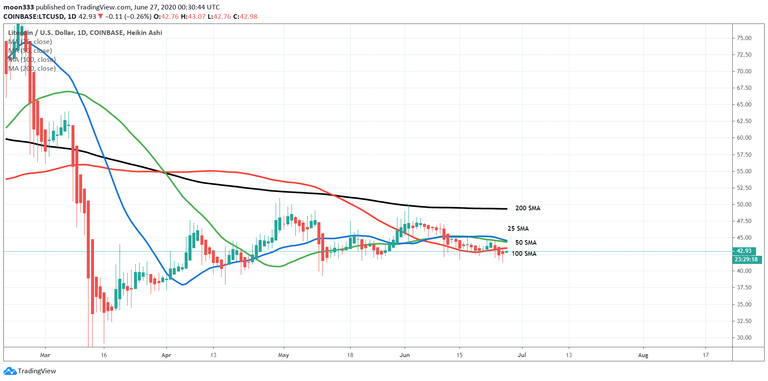
If we watch the different simple moving averages with the time period of 25 50 100 and 20. Then it can be easily seen that the priceline of Litecoin has broken down all the simple moving averages and has no support of any SMA below the candlesticks. Therefore I would repeat again that we should take care of our stop loss and you can set your stop loss point at the maximum extent of potential reversal zone of BAT pattern.
Movement in up channel and EMAs:
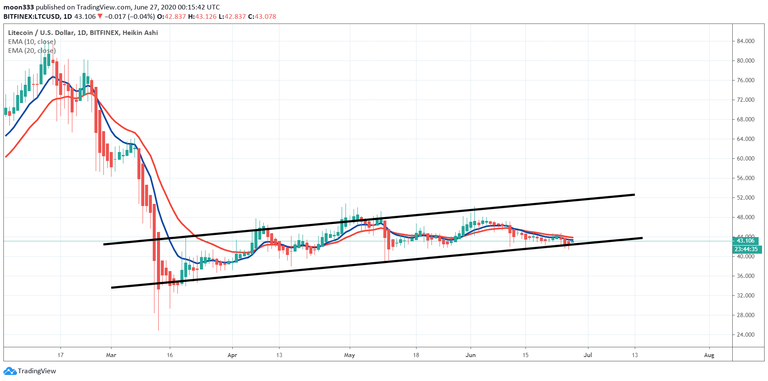
Since mid of March 2020 price action is moving in an up channel and during this movement it is using the exponential moving averages with the time period of 10 in 21 as good support. At the moment price action of LTC has broken down these two exponential moving averages but having a strong support of up channel. If this channel will be broken down then a new bearish rally can be started that will take the price action more down.
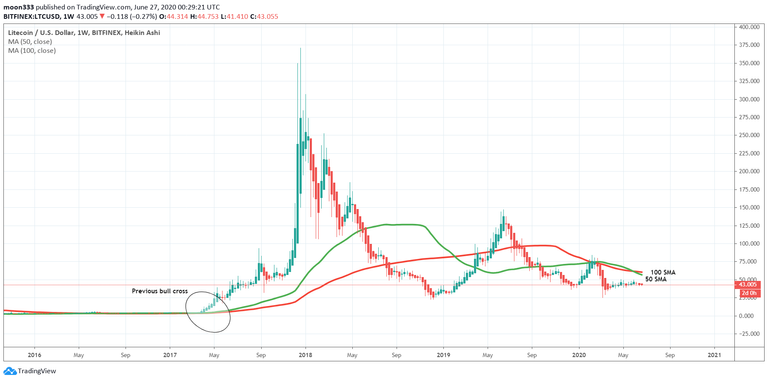
On the long term weekly chart I am waiting for the formation of bull cross between 50 and 100 simple moving average. If we take a look back at 2016 to 2017. Then after the formation of this bull cross if a strong bullish rally was started that led the price action to $370. And this is the highest price ever.
A bull flag between 50 and 100 SMAs was formed in Feb 2020. And after this cross we witnessed a powerful bullish rally in that month. But that cross was formed above the price action the difference between this bull cross and the previous cross is the previous bull cross between 50 and 100 simple moving averages was formed blow the candlesticks but the current cross was formed above the candlesticks. If we want to see a powerful bullish move like we have seen back in 2017. Then we need this cross below the priceline. At this time the distance between the candlesticks and moving averages is very small. Therefore at anytime price action can cross up the moving averages and we can see a bull cross formation below the candlesticks.
Click here to create free account on tradingview to watch and play the chart on realtime
Conclusion:
Even though the distance between the moving averages and the candlestick on weekly chart is very small but this is a fact that at this time the priceline has no support of any moving average on the daily chart. Therefore we should take care of our stop loss. However the BAT formation can save the priceline to break down the channel. And if the price action will take the bullish divergence from the potential reversal zone of the BAT then the price action can move up at least up to the resistance of the channel and that is at $50.
Note: This idea is education purpose only and not intended to be investment advice, please seek a duly licensed professional and do you own research before any investment.