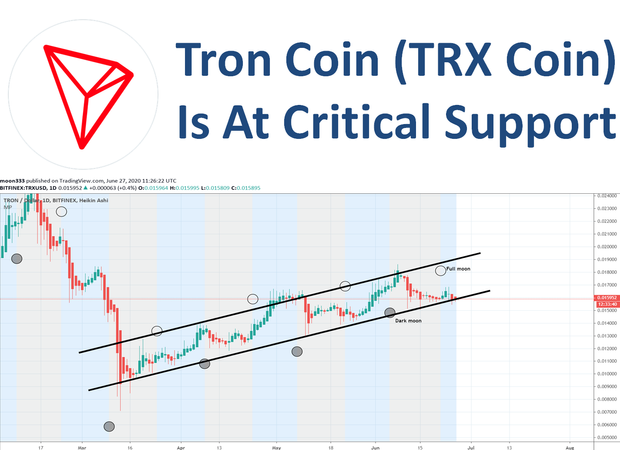
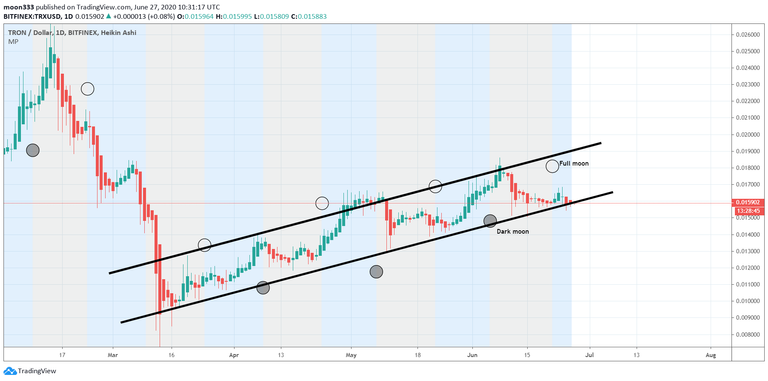
Hi guys and gals hope you are good and welcome to the new update on Tron coin. The priceline of TRX coin is moving at the support of the channel. In today's article we will try to understand whether it will move more bearish it will move up from here. I have also placed the moon phases indicator on this channel. This is a very useful indicator to predict the movement of the price action especially when it is moving within the channel. It can be clearly seen that the recent dark moon is at the support and the recent new moon is below the resistance of the channel. The distance from one dark moon to another dark moon and one full moon to another full moon is called synodic cycle that is 29.5 days long. And if we calculate the life of the recent dark moon then it appeared 23 days ago. It’s mean that 5 to 6 days are left for the new dark moon to appear. But as a new full moon is recently appeared below the resistance therefore we can have an idea that the new dark moon can be appeared below the support. And if it will be appeared below the support then there will be more chances that the price action will break down the support of channel.
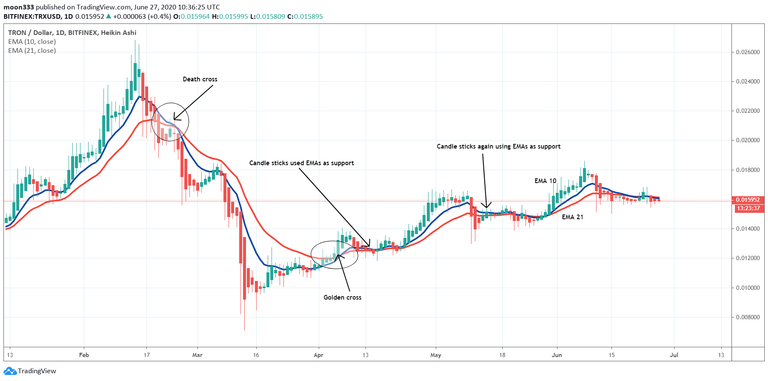
The EMAs:
If we watch the exponential moving average with the time period of 10 and 21 then after the bear cross that was formed on 25th Feb 2020 the EMAs formed a bull cross on 7th April and the pricline of Tron also crossed up the exponential moving averages. Since then the price action is using these two EMAs as good support. But at this time the price action is likely to break down these two exponential moving average but still having the support of the channel. Therefore if the support of the channel will be broken down then definitely the price action will also start moving below these EMAs again and start a new bearish rally.
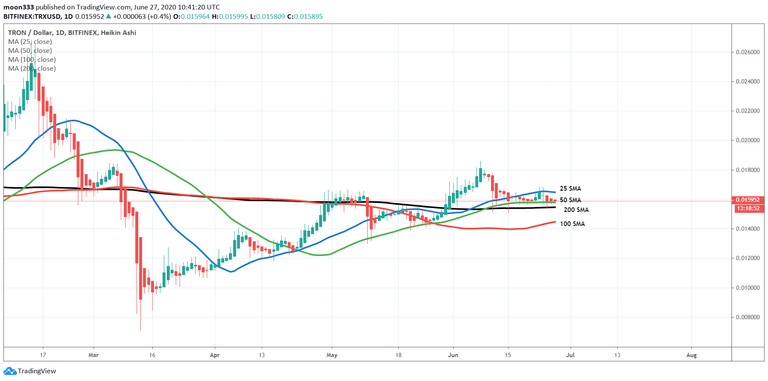
The SMAs:
Now if we take a look at simple moving averages with the time period of 25, 50, 100 and 200 on the daily chart. Then the price action has just broken down the 25 simple moving average and having a good support of 50 simple moving average since 18th of June. If this 50 simple moving average will be broken down then TRX has another strong support of 200 simple moving average. This is the most strongest support on the daily chart therefore we can use the 200 SMA as stop loss.
However the 100 simple moving average is also moving up to form a bull cross with 200 SMA. If this cross will be formed then the support of the channel can be saved and the price action can move upto the resistance of channel.
A descending triangle:
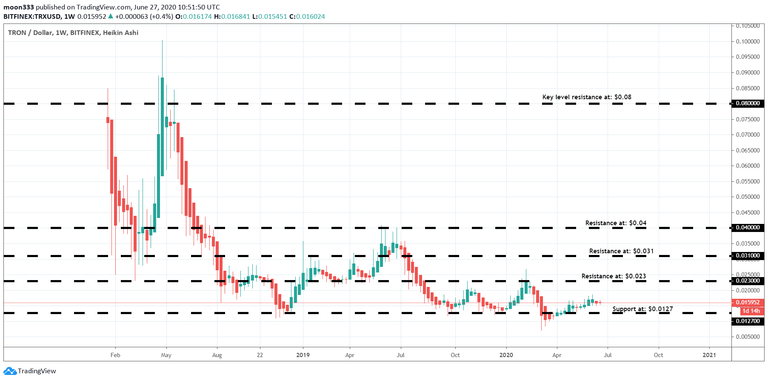
Now if we switch to the long-term weekly chart then the price action is moving in a descending triangle. At this time the price action is moving sideways after reaching at the resistance of this triangle. The priceline of the TRX is at the end of this pattern and we can see that triangle is getting squeezed. Therefore it is a decision-making time for the priceline of Tron to breakout or breakdown. However, if we see the support of this triangle then it is really very strong as it is not broken down since November 2018. If the price action will start a bearish rally from here and break down the channel and the moving average supports. Then it can be reached up to the support of the triangle that is as $0.012.

Supports and resistance levels:
If we watch the long-term support and resistance levels. Then we have a strong support at $0.012. That is working as a strong support since November 2018. Then we have next resistance level at $0.023 if this resistance will be broken out then we have the other resistance levels at $0.03 and $0.04. If the $0.04 resistance level will be broken out then there is no significant resistance on the long-term chart upto $0.08.so this 100% gap can be filled within no period of time. And the $0.08 resistance level is key level resistance for the priceline of the TRX. if it will be broken out then price action can reach up to the previous highest price very soon.
Click here to create free account on tradingview to watch and play the chart on realtime
Conclusion:
Tron coin is at a very critical support of the channel. Therefore we should take care of stop loss as we have discussed in the article. Because if the support will be broken down then price action can move at the previous support at $0.012 to have another bounce for bullish move.
Note: This idea is education purpose only and not intended to be investment advice, please seek a duly licensed professional and do you own research before any investment.