I recently came across this tweet from binance and found it very helpful and i hope you find it helpful as well.
Candlesticks
Candlestick Patterns is a method of reading the price chart.
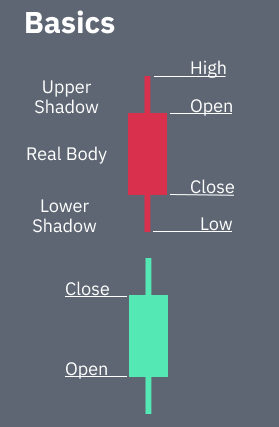
A red candlestick means that the price closed lower than where it opened. Sign of bearishness. Bears/Sellers pushed the price below to the closing price.
A green candlestick means that price closed at a higher point. Sign of bullishness. Bulls/buyers pushed the price up and price closed higher than before.
Wick/Shadow is the highest/lowest price bet but not where the price closed.
Some popular patterns.
- Engulfing Pattern
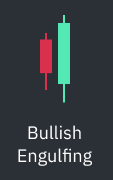
You can see how the second candlestick has completely engulfed the first one. This pattern generally acts a a reversal of downtrend pattern and is a sign of bullishness in market.
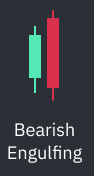
Opposite to the above. Second candlestick has completely engulfed the first one acting as a sign of bearishness in the market.
2.Hammer & Shooting Star.
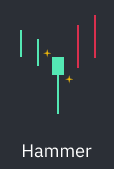
Sellers pushed the prices to a low point as seen by the long lower wick or shadow but bulls took charge and pushed the prices up high to closing point. This indicates a sign of bulls strength. This pattern is generally followed by a price uptrend. This is a bullish reversal as in trend is now bullish from bearish.
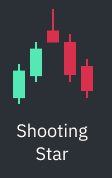
Opposite to the above. Bulls were in control pushing price to a high but bears took control and pushed the prices down. Generally followed up by a price downtrend. Bearish Reversal.
3.Dragonfly and Gravestone Doji.
Doji-
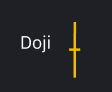
A completely neutral pattern indicating market indecisiveness. Neither the bulls nor bears are able to take control.
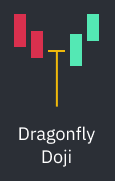
Depending on the past behavior of bulls and bears this doji can act as a reversal to the past trend as in from bullish to bearish or vice versa. Sellers were aggressive and pushed the price to low but bulls took charge and brought the price to same open. Open and close are the same in this case. Following a bearish trend this doji confirms a bull trend is coming. The next candle confirms this.
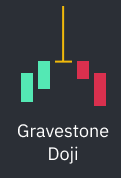
Opposite to the above. Bulls were aggressive bringing to a high but bears took charge and brought the price to same starting point. Same open and close again.
4.Morning & Evening Star
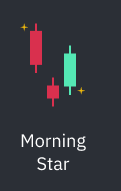
Bullish reversal pattern. Followed by a downtrend. First candlestick is a bearish one. Middle candlestick acts as a market indecisiveness and the next one as bullish.
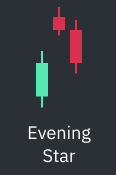
Opposite to the above. Bearish reversal pattern.
These are some of the most important and widely used candlesticks patterns. Always remember never use these candlestick patterns in isolation. They are to be used with in conjunction with other trend patterns because cryptocurrencies are so volatile that you need multiple instances to confirm your analysis and even then the opposite may happen. Various tools like MACD, MA, RSI should be referred to as well while performing your analysis.
This article was first published on publish0x under my blog noBeans. I am the owner of this article
Hi! I am a robot. I just upvoted you! I found similar content that readers might be interested in:
https://www.publish0x.com/nobeans/candlesticks-and-their-patterns-xnlxrdw