Following my series about assessment on simple Candlestick patterns, I think, with this one I am going to close the series regarding this kind of signals.
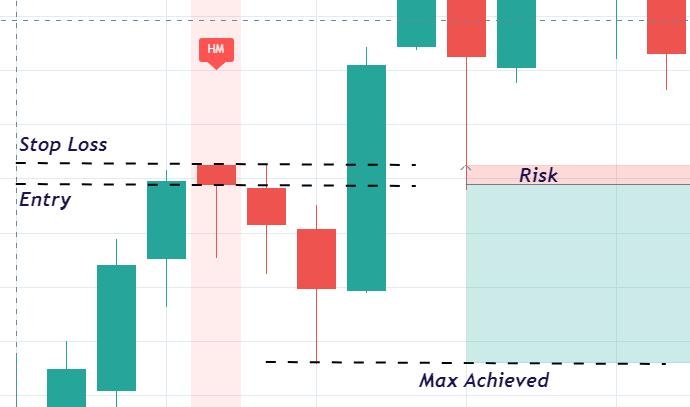
This time I had a look on the indications about the "Hanging Man" candlestick. This one is a one candle pattern that appears on an uptrend and it can be identified for having a short body on the top and a long shadow below. Usually, the shadow should be at least twice the height of the body and, normally, the longer the shadow the most efficient and trend-reversal indicative should be.
However, looking the historical chart of BITCOIN, this is a very weird pattern with a low recurrence in time.
Anyway, I have identified a few on the 4h and 1h timeframes so maybe I could produce some outputs about.
Only with the intention to see the "potentiality" of the signal, I will keep the following assumptions of the trade:
- Entry placed on the closure of the candle (see below "entry")
- VERY IMPORTANT: Risk of Loss limited always to the top of the candle (see below "Stop Loss"). The assumption is to set a stop loss always there, limiting the risk but it could be different depending on your risk management.
- The profitability of the pattern is taken as the maximum achieved before reaching above the Stop Loss, of course, it depends on the trader to close position depending on other observations or targets but, here, I just want to see the potential of the indication not the real output.
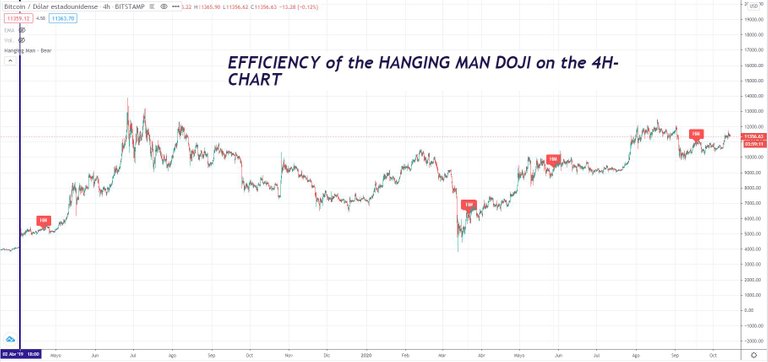
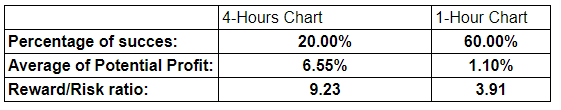
Assessment on the 4-Hours Chart since April 2019.
As I said, the frequency of appearance of this indication is really low, only 5 indications found since April 2019, additionally, only one demonstrate a good profitability while the others shown a very low losses according to the taken assumptions.
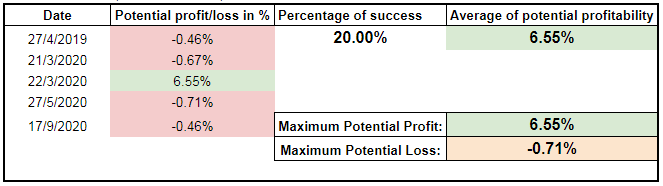
- Percentage of Success indicator: 20%
- Average of Potential profitability: 6.55%
- Reward/Risk ratio: I would take the average potential profitability divided by the maximum potential loss (remember that is cut due to our stop loss assumption explained before) = 9.23 so, for every USD you put under risk you might obtain 9.23 USD
On this last output, the Reward vs Risk ratio, I have to say that due to the low recurrence of the signal, it has been impossible to get a realistic average since we had only one trade with a positive profit over the 5 indications.
Assessment on the 1-Hour Chart since early May 2020.
On this timeframe, despite the recurrence is still low, we had 10 in total.
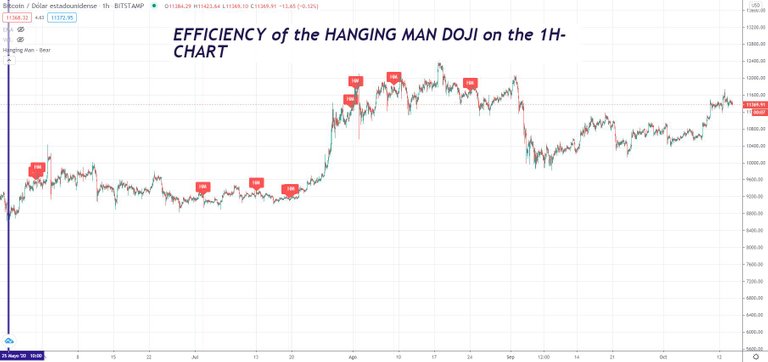
6 out of the 10 signals, performed well however the power of the signal produced low profits and did not indicate a sustained trend reversal.
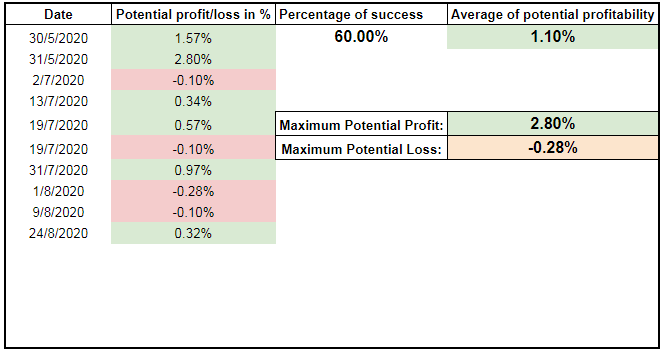
- Percentage of Success indicator: 60%
- Average of Potential profitability: 1.10%
- Reward/Risk ratio: I would take the average potential profitability divided by the maximum potential loss (remember that is cut due to our stop loss assumption explained before) = 3.91 so, for every USD you put under risk you might obtain 3.91 USD.
Summary
In my opinion, this pattern cannot be used in a daily-trading manner. The low recurrence on the 4h timeframe combined with the very low profitability on the hourly do not provide so much confidence. I would say that only when the pattern is strong, meaning by "strong" an evident short body in comparison with a long tail, it might be used as an indication of a trend reversal but not as an exclusive tool on which base the trade.
This assessment just provide some more light on the statistical output of a famous pattern. I will try to complete the assessment with more data as soon as they appear.
Hope you have enjoy it.
Other Related Posts:
- Candlestick Patterns: How efficient is the Bullish Engulfing Pattern on BTC trading?
- Candlestick Patterns: How efficient is the Bullish Hammer Candlestick on BTC trading?
- Candlestick Patterns: How efficient is the "Inverted Hammer" Candlestick on BTC trading?
- Candlestick Patterns: How efficient is the "Bearish Engulfing" Candlestick on BTC trading?
- Candlestick Patterns: How efficient is the "Bearish Shooting Star" Candlestick on BTC trading?
- Efficiency of the RSI indicator as unique trading tool on BTC/USDT pair
- Efficiency of the Bollinger Bands indicator as unique trading tool on BTC/USDT pair
- Candlestick Patterns: How efficient is the "Bearish Shooting Star" Candlestick on BTC trading?
I'm sharing only my quick trading Ideas here, not financial advice at all ;-)
*Disclaimer: This is just my personal point of view, please, do your own assessment and act consequently. Neither this post nor myself is responsible of any of your profit/losses obtained as a result of this information.


Another question, if you don't mind?
(wish I could upvote again to go along with it)
I'm trying to write up an algorithm to recognise the bearish hanging man..
Would an additional requirement for this signal be that the opening price is equal to the high price for the period? Or is there some small margin that the high price could be above the opening price?
Posted Using LeoFinance Beta
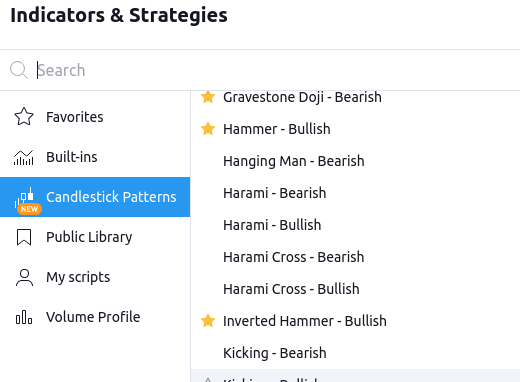
Tradingview has all of those algorithm already working:
Thank you for this in depth explanation! Is the percentage of success indicator essentially a count of how many trades resulted in profit? if so what indicates the sale price?, or is it a count of how many hanging man signals correctly predicted an uptrend? if so what indicator do you use to verify the uptrend?
Posted Using LeoFinance Beta
This is only an assessment on how many of those indications had potential to be on profits.
So far, from those I have checked, the most successful candlestick pattern is the Bullish or Bearish engulfing (see the link to the particular assessment below in the post)