Intro
I had been thinking about pricing patterns in Rise of the Pixels. To this end, I looked at some of the JSON transactions to see how accessible the data was. I'm not super "techy" but I know how to get data out of HiveSQL. Unfortunately the sales transactions only have the NFT unique ID, so it would have to be joined with some other transactions to get the characteristics of each NFT, and that was a little much for me.
@asgarth to the rescue! He mentioned today in the discord that there is historical market data available at https://riseofthepixels.com/market/logs
Fantastic! I took a quick look and requested a column with the stats for each card. Since he has a quiet morning, her turned it around already and now I have everything I need.
I'm not sure how the tables are meant to work with Chrome, but if I keep scrolling to capture everything the page eventually errors and I get nothing. So I scrolled a little ways and this analysis is only the latest ~300 sales. This includes about 240 "Team" sales, which will be my initial focus. If the analysis is well received, I will grab more data and try to replicate for Accessories and Research.
High-level Findings
First, the high-level obvious stuff:
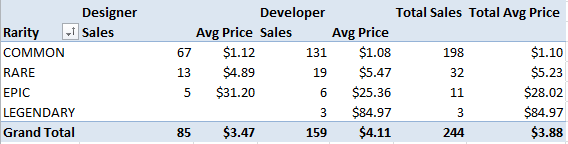
Pricing escalates with rarity.
Designers are cheaper(?). I expected this, since developers can also be used for R&D, but it surprised me that this relationship only held at rare. With no Legendary Designers, the overall average is skewed. My theory is that common pricing is dominated by fusion demand and rare pricing is driven by desire to improve studio performance. We will have to do separate regression analysis for each rarity to see.
Stat Correlations

The game tells you that some of the stats have a relationship. Strong correlations can be a problem for regression analysis, so I wanted to check this out before getting into regression analysis.
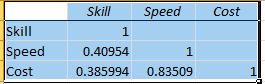
I'm not worried about the relationship between skill and speed, but I need to choose between speed and cost for inclusion in my regression analysis. I find speed to be more intuitive than cost, so I'm going to include speed and drop cost.
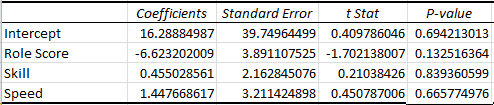
Regression
I started with a high-level analysis, before breaking it out for each rarity separately.
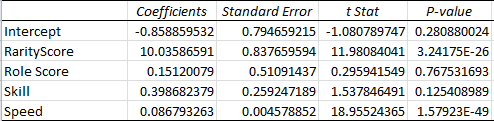
Broadly speaking, the intercept would be the value of a Common Designer with no stats (no such thing exists, so the negative isn't surprising or a problem). Each point of rarity adds $10 average... that's clearly too much, since the step between common and rare is half that... what we're actually seeing is the huge impact of outliers (the three legendary cards). So basically the distribution of the data-set makes a combined analysis complete garbage. Lets get into rarity analysis without further discussion.
Common
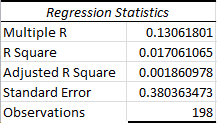
I expected lower R values for Common, but... um... what? This implies that common pricing doesn't care about stats at all, it's entirely driven by purchases for fusions.
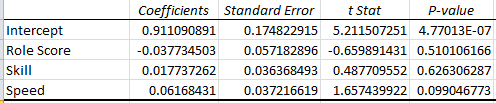
We're looking for p-values below 0.05; but really the smaller the better. In a market that is looking for fusions and not caring about stats, these are expected values. Tiny emphasis on speed, but otherwise only fusion value matters.
Rare
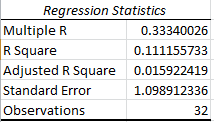
I thought that rare would get into more stats-driven purchases, but that doesn't seem to be the case. Is this market totally driven by fusion?
We're seeing here that only half the value comes from just being rare, and more value starting to come from stats, but none of this is statistically significant yet. That came as a surprise to me.
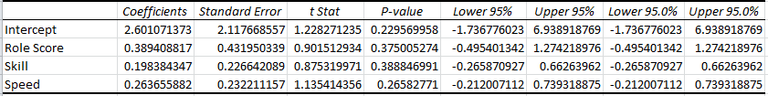
Epic
We only barely have enough data for Epic, and we don't have enough data for Legendary.
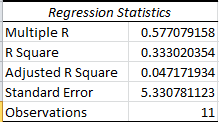
Nothing here is statistically significant. Going with the "I need more data" cry. I'll have to try again in a week and see what things look like as the market matures.
Conclusions
I believe the current market is driven by fusions, rather than by studios looking to optimize for talent. I don't have a solid pricing strategy from this. Try to get the fusion cards you need as cheaply as you can, but sell as dearly as you can?
What really surprises me in this market is the ratios between average prices by rarity.
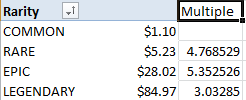
If you need 5 points, then 4, then 3, you would expect multipliers along that curve, maybe a little higher. Instead we see the average price to fuse a rare from common is higher than the price to just buy a rare. To which I say... people love the fusion game and aren't thinking about games making ROI, in spite of the ROI complaints you see in the Discord?
Quick update:
@asgarth sent me a file that has all of the sales history (932 items).
Here is the key table:
I hope to do a full update with the rest later.
makes sense about the fusions leading to sales. I almost only buy for that reason. Also fun to see the averages. They seem a little high kinda not sure if i wanna see pack resellers come in. haha
There are pros and cons to pack resellers. The variance of a pack is fun for some, but a turnoff for many. Why pay $3 for a chance of getting something worth $1 when you could just pay $5 for what you want? When you open a big enough stack, it smooths out the variance, but then you have to turnover enough of your inventory without crashing the market. As there are less than 1000 total sales thus far, a reseller needs to be very patient even for a minimum reseller stack of 100 packs (ideally a reseller would be doing stacks of 200 for the extra boost, but the 2 extra cards might not be worth it for the increased inventory risk).
The key advantage to having resellers in the game is that it brings the prices down for everyone else that wants to build out by buying exactly what they need.
Congratulations @josephsavage! You have completed the following achievement on the Hive blockchain And have been rewarded with New badge(s)
Your next target is to reach 3250 replies.
You can view your badges on your board and compare yourself to others in the Ranking
If you no longer want to receive notifications, reply to this comment with the word
STOP