
Welcome to the daily financial report about the Hive blockchain.
All the information presented in this report is based on the data collected from the blockchain until 2021-08-29 midnight UTC. This report aims to provide you with a clear view of what is happening on the Hive blockchain.
1. Price
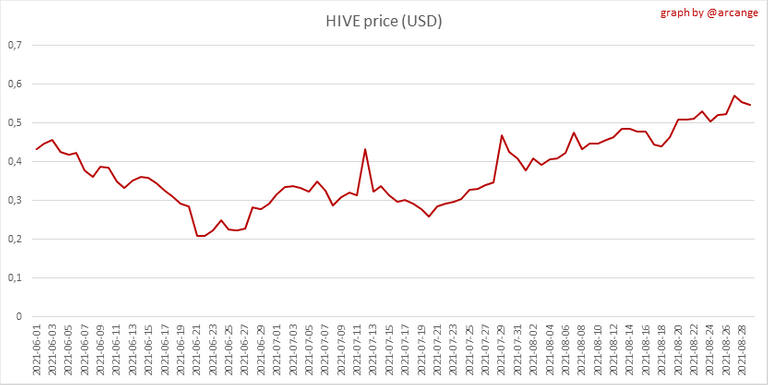 | 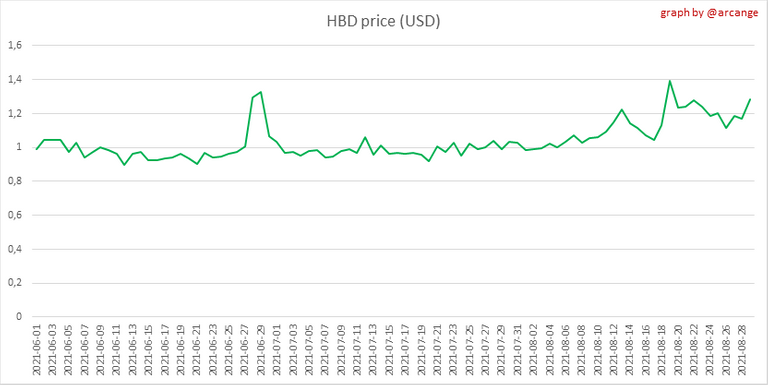 |
These graphs show the evolution of prices in USD for HIVE and HBD.
2. Supply
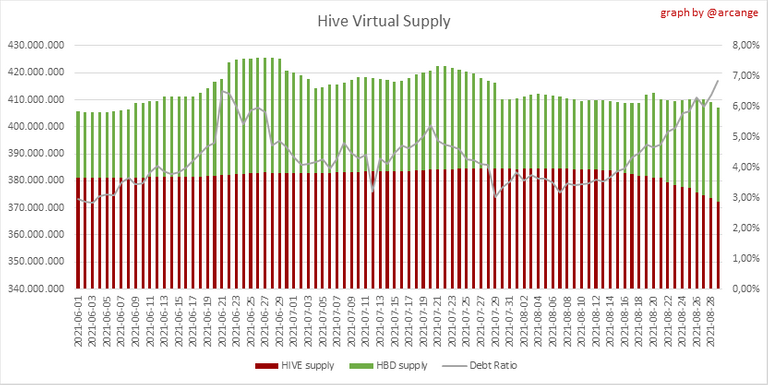
This graph shows the evolution of HIVE Virtual Supply. The virtual supply is the sum of HIVE supply (liquid Or staked HIVE) and HBD supply (converted into HIVE).
The graph also displays the debt ratio (HBD supply / HIVE supply). Keep in mind that since hardfork 24 funds in the treasury (@hive.fund wallet) don't count towards the HBD debt ratio
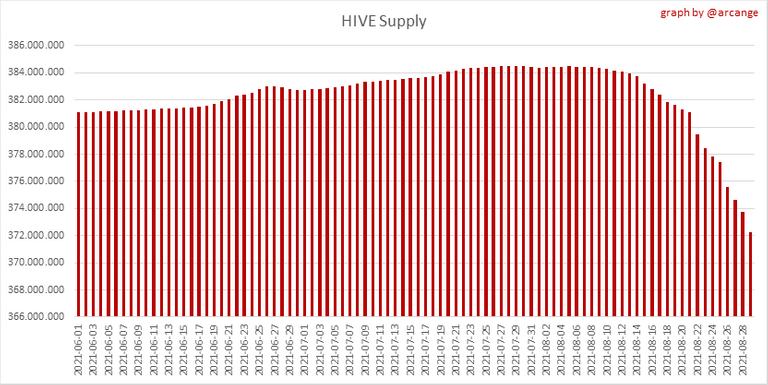 | 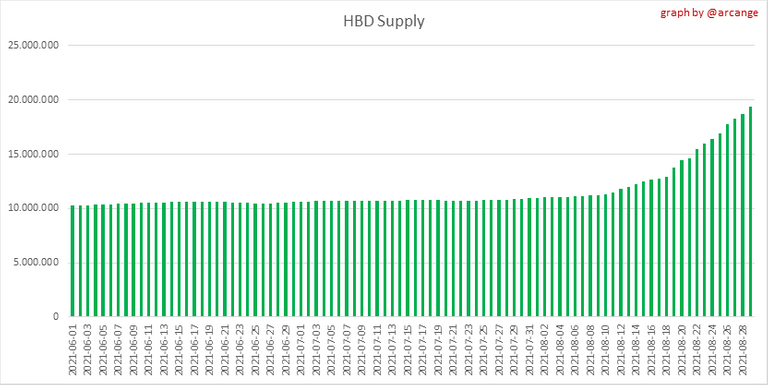 |
These graphs show the evolution of the HIVE Supply (both liquid and staked) and the HBD supply.
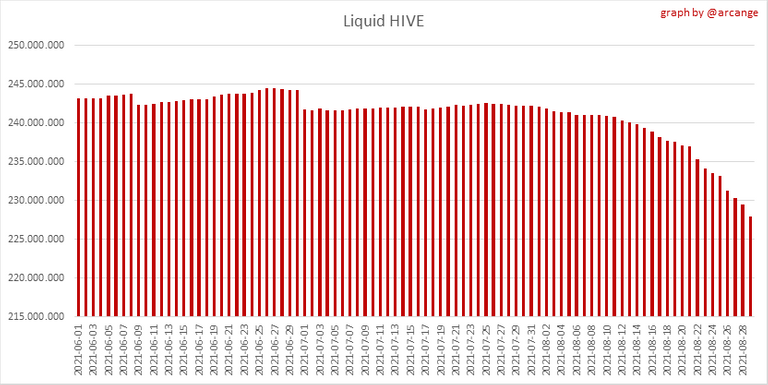 | 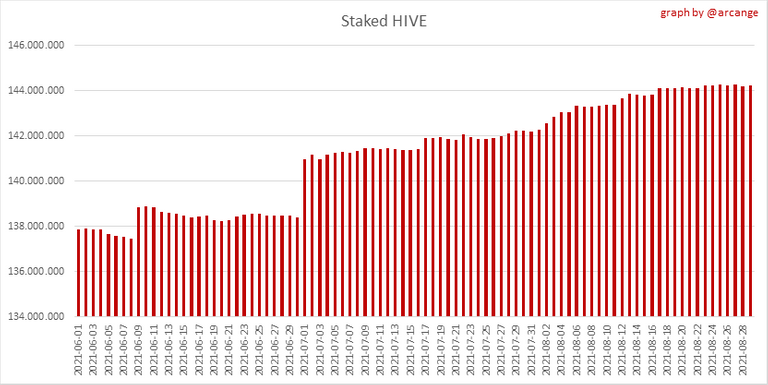 |
These charts show the evolution of the liquid HIVE and the staked HIVE (Hive Power).
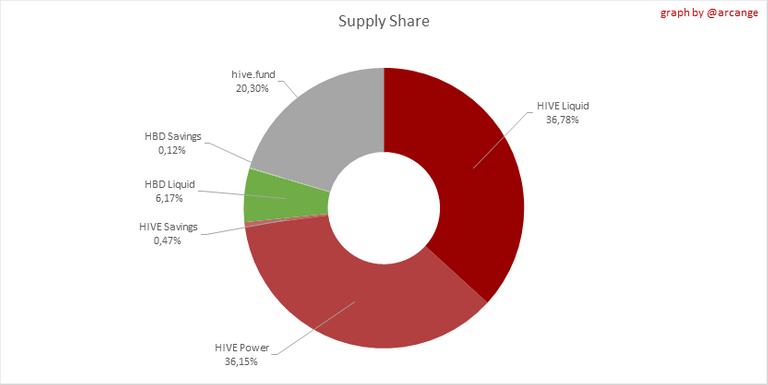
This graph shows the overall Hive tokens distribution
3. HBD Savings
Note: As of 2021-06-30 (HF25) interest Is only paid for HBD which are stored in savings.
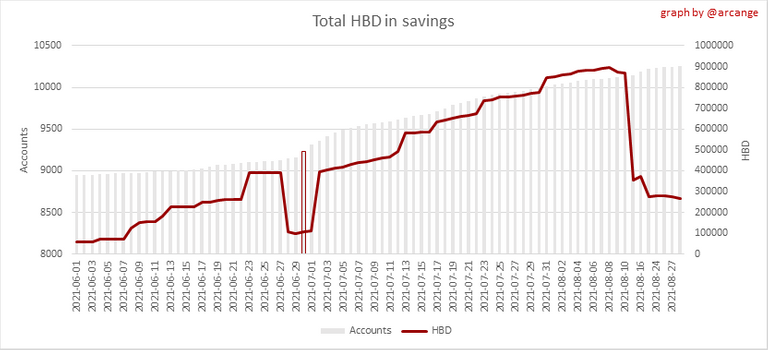
This graph shows how much and how many accounts store HBD in savings.
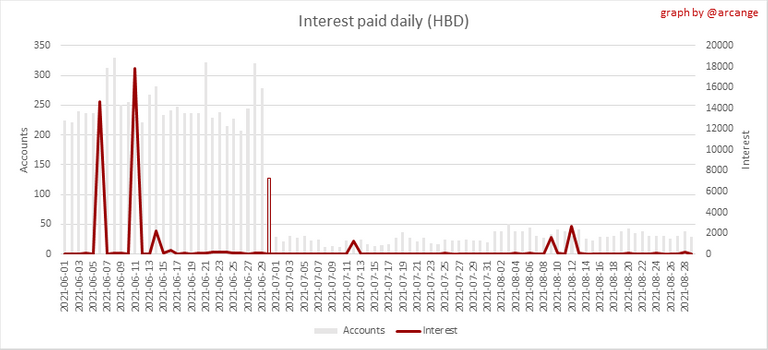
This chart shows the amount of interest paid each day for holding HBD and how many accounts received such interest.
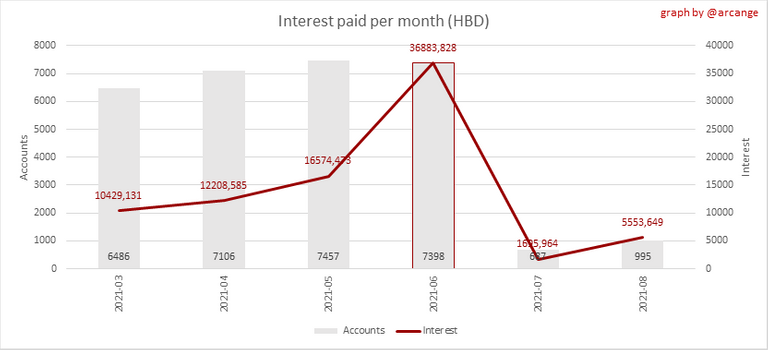
This chart is the same as the previous one, but data are grouped by month.
4. Balances
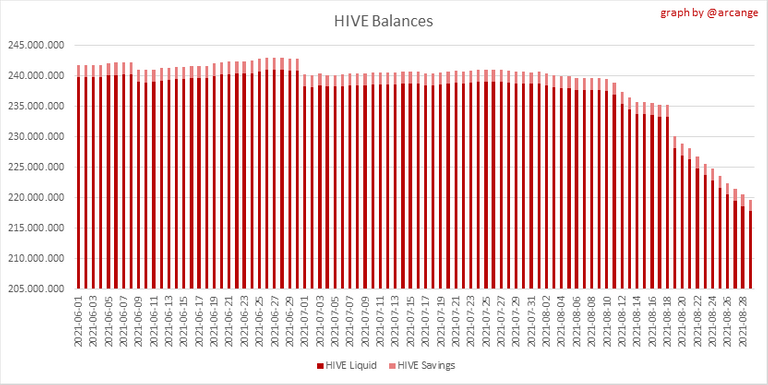
This graph shows the number of HIVE, both liquid and In savings, held by all accounts.
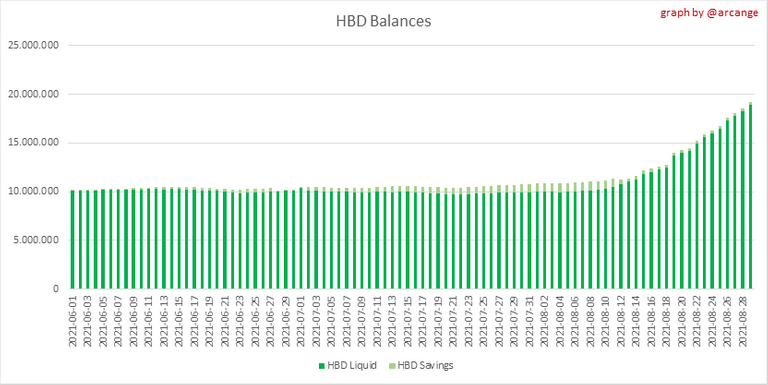
This graph shows the number of HBD, both liquid and In savings, held by all accounts
5. Conversions
Note: As a reminder, conversion requests are only finalized after 3 days. It is only then that it is known exactly how many HIVE were burned in return for the HBD received at the time of the conversion request.
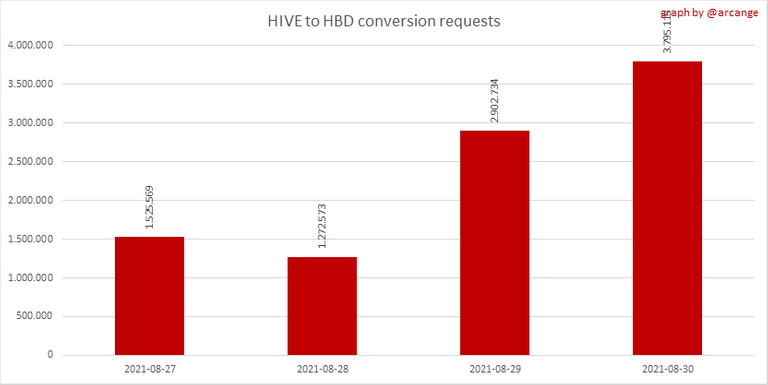
This graph shows the number of HIVE collateralized due to requests to convert HIVE to HBD over the past few days.
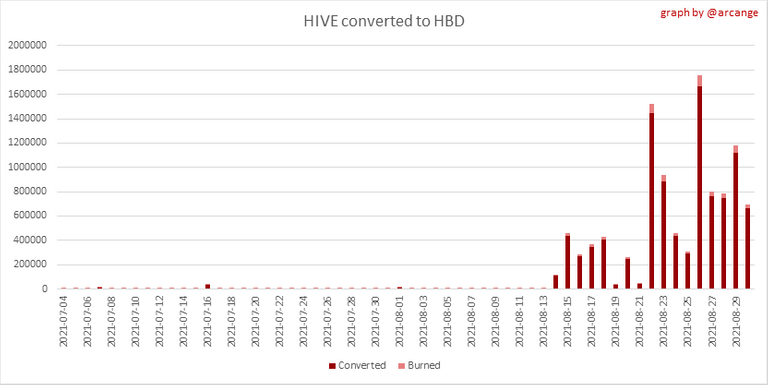 | 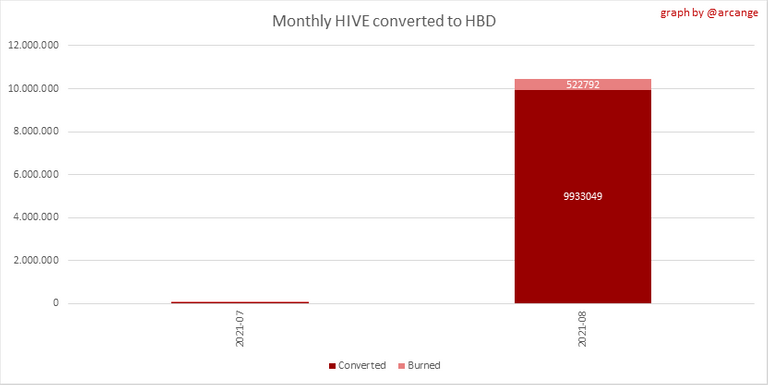 |
These graphs show the number of HIVE effectively used by the conversion process (HIVE converted and 5% HIVE fee which is burned) each day and month when requests to convert HIVE to HBD have been finalized.
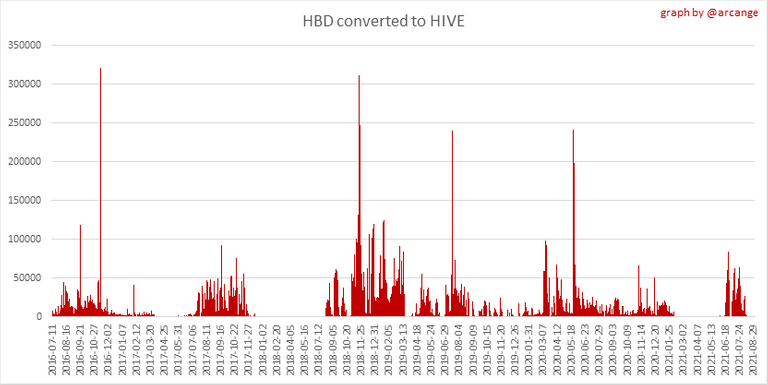 | 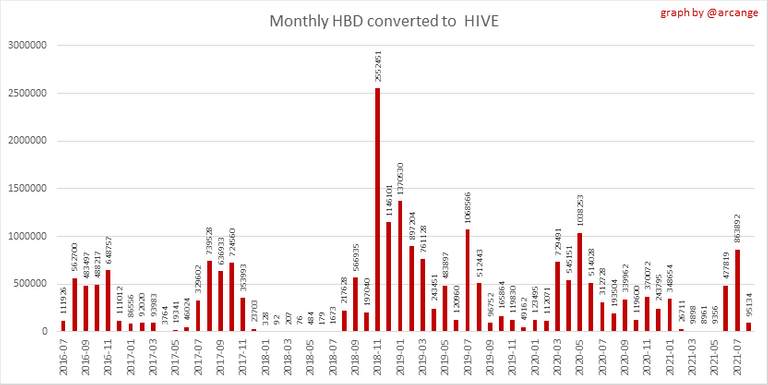 |
These graphs show the number of HBD burned, each day and each month, following requests to convert HBD to HIVE.
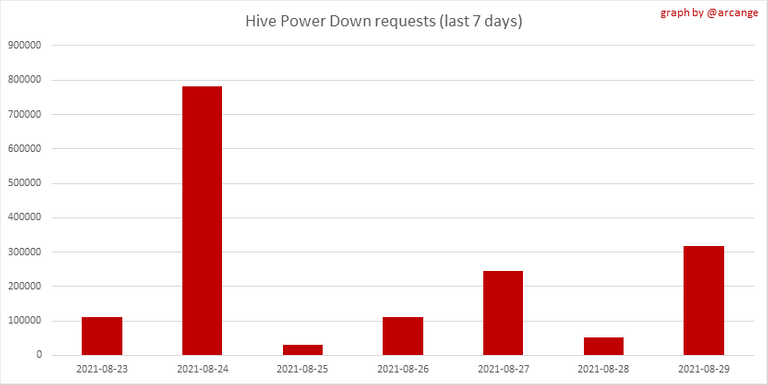
6. Power Up and Down
| Date | Account | Amount |
|---|---|---|
| 2021-08-29 08:22:06 | @appreciator | 412,902.971 HIVE |
| 2021-08-29 07:23:27 | @kingfadino | 96,901.489 HIVE |
| 2021-08-29 11:45:24 | @jaster | 22,999.990 HIVE |
| 2021-08-29 03:53:27 | @ladywalker | 7,929.359 HIVE |
| 2021-08-29 08:43:57 | @syndromet | 6,259.296 HIVE |
| 2021-08-29 03:56:48 | @revo | 6,121.042 HIVE |
| 2021-08-29 02:41:18 | @dine77 | 4,061.955 HIVE |
| 2021-08-29 02:13:18 | @soyunasantacruz | 3,144.622 HIVE |
| 2021-08-29 07:15:39 | @calisto24 | 2,692.405 HIVE |
| 2021-08-29 03:19:54 | @pedrovivaz | 2,404.596 HIVE |
This graph and table show the amount of power down initiated over the last 7 days, and who initiated the largest yesterday.
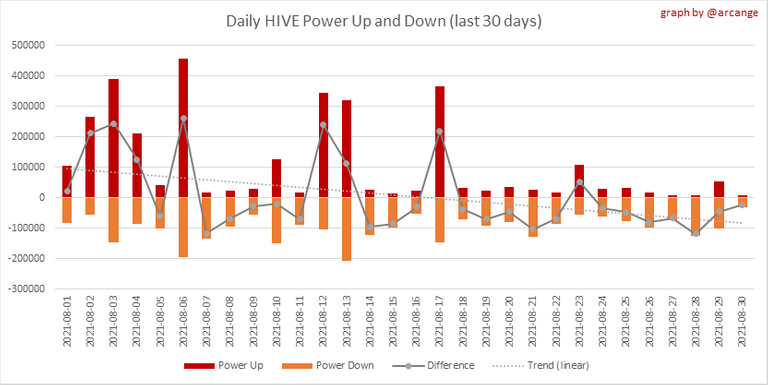
This graph shows the daily HIVE power-up, power-down, and the resulting variation over the last 30 days.
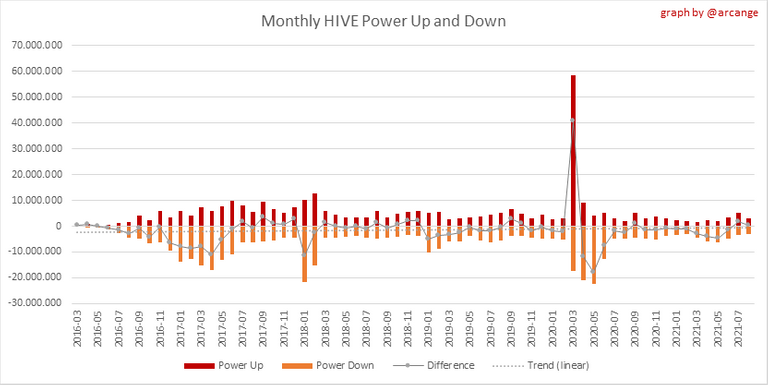
This graph shows the monthly HIVE power-up, power-down and the resulting variation.
Topmost power-ups and -downs of the day
| Account | Power Up | Account | Powerdown |
|---|---|---|---|
| @ecoinstant | 12,888.094 HIVE | @appreciator | 17,129.936 HIVE |
| @cooltivar | 10,030.556 HIVE | @gringalicious | 15,902.623 HIVE |
| @beverages | 6,439.161 HIVE | @memehub | 13,590.172 HIVE |
| @vicesrus | 5,874.697 HIVE | @frot | 7,756.072 HIVE |
| @fractalfrank | 5,644.761 HIVE | @nateaguila | 4,012.380 HIVE |
| @aileecho | 2,492.921 HIVE | @mintdice | 3,483.504 HIVE |
| @atardeceres81 | 2,050.137 HIVE | @thecryptodrive | 3,271.240 HIVE |
| @dcrops | 835.500 HIVE | @mahdiyari | 3,006.941 HIVE |
| @planetoceana | 673.993 HIVE | @ew-and-patterns | 2,537.651 HIVE |
| @charlie80 | 663.018 HIVE | @steempeak | 2,436.487 HIVE |
7. Transfers
These graphs show the volume (in USD) of HIVE and HBD transferred between accounts.
8. Exchanges
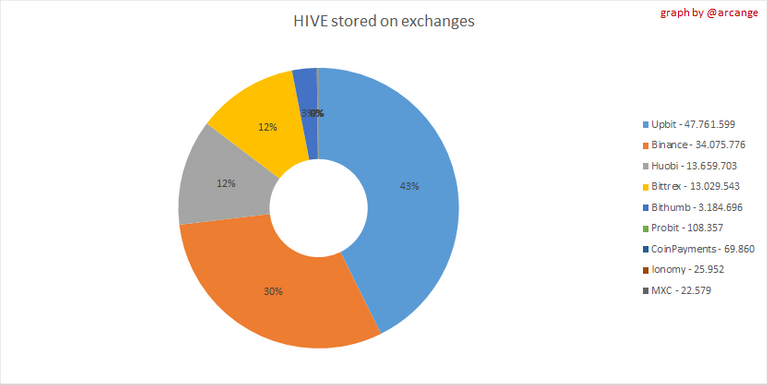
This graph shows the amount and distribution of HIVE stored on the exchanges where HIVE Is listed.
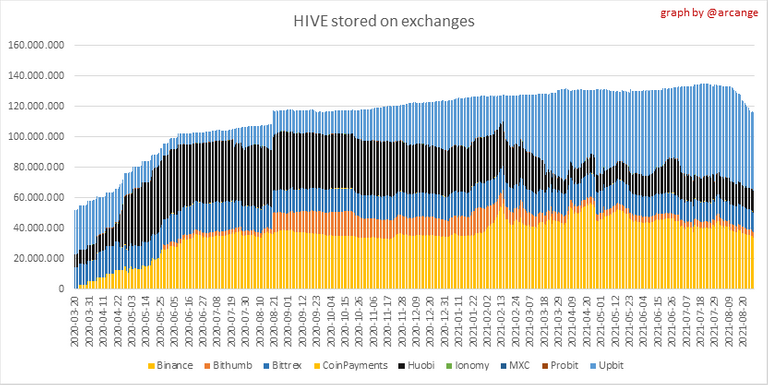
This graph shows the daily evolution of HIVE stored on the exchanges where HIVE Is listed.
I hope you find those stats useful. If you would like to see different stats, feel free to drop me a comment. Your feedback is more than welcome.
Thanks for reading.
Check out my apps and services


Hi Arcange. There's an flaw in the powerdown stats somewhere. I've just started a powerdown of about 3,400 hive, not 6,100.
(and to explain myself, I'm not going to powerdown it all. Just taking a small amount of profits).
You're right. I had a rounding issue in my formula (which has been fixed for the next posts)
Thanks for notifying me.
Sorry, out of BEER, please retry later...
At the current rate, the HBD debt limit will be hit in less than a week. That is unless demand for HBD collapses in that time, or there is a much larger Hive price surge.
!PIZZA
!BEER
@arcange! I sent you a slice of $PIZZA on behalf of @eii.
Did you know you can trade $PIZZA on Hive-Engine, Tribaldex, or LeoDex? (1/10)
If I'm reading your graphs right, it looks like 20M Hive is no longer liquid. And it looks like 10M of that Hive got converted to HBD and an additional 0.5M Hive got burned during the process. So that seems to imply that 20-10.5 = 9.5M Hive that got "net powered up" (by net, I mean including power downs). Oh, never mind, I think I just realized I'm missing another component: Hive sent back to the DAO by the stabilizer. Anyways, would be interesting to see what the net powerup/down was for the month.
The net monthly powerup/down is visible in the third graph of section 6.
Unfortunately, the huge spike in power-ups on 2020-03 prevents us to approximate its value.
I will add a table with last months' data in my next posts.
Update the post with the last 3 months' values. If you need more, let me know.
Ok, so if I'm reading your graph right, then powerup/powerdown was mostly "net neutral" during the past 30 days. Leaving unexplained where the other 10M Hive went. I suppose it could have all be Hive converted by stabilizer to HBD. But if we assume an average of 50K HBD worth of Hive bought per day by the stabilizer, that is less than 1.7M HBD per month (50K * 30 days = 1.65M HBD), and at a "profit rate of 1.20 USD/HBD", that would still only be 1.7*1.2 = 2M USD, which at a Hive price of .50 USD would only be 4M Hive converted. So I can't figure out where the other 6M Hive went...
[Edit] Hmm, I wonder if it could just be Hive still locked up in collateral from ongoing Hive->HBD conversions.
Correct.
That's what I thought too.
hello, i'm new around here
https://ecency.com/hive-174578/@anonimato07/my-introduction-to-the-hive
Welcome to Hive @anonimato07.
Please avoid spamming other users' posts with links to your own posts.
This is considered a bad practice and could lead to you being downvoted and your reputation destroyed.