
Welcome to the daily financial report about the Hive blockchain.
All the information presented in this report is based on the data collected from the blockchain until 2021-09-17 midnight UTC. This report aims to provide you with a clear view of what is happening on the Hive blockchain.
 Este post está traducido al español - aquí
 Dieser Beitrag ist ins Deutsche übersetzt - hier
 Une version en français de ce post est disponible - ici
1. Price
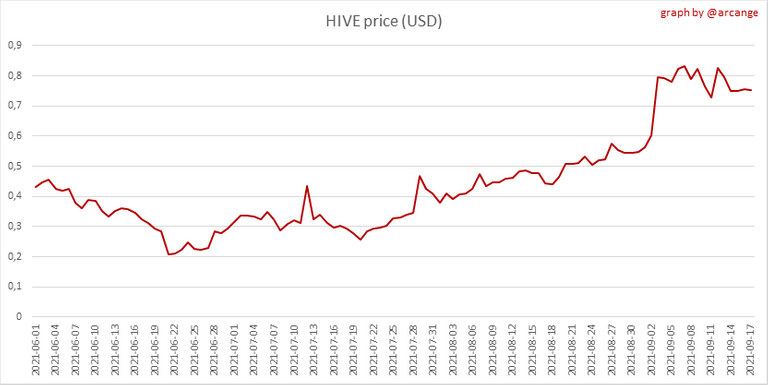 | 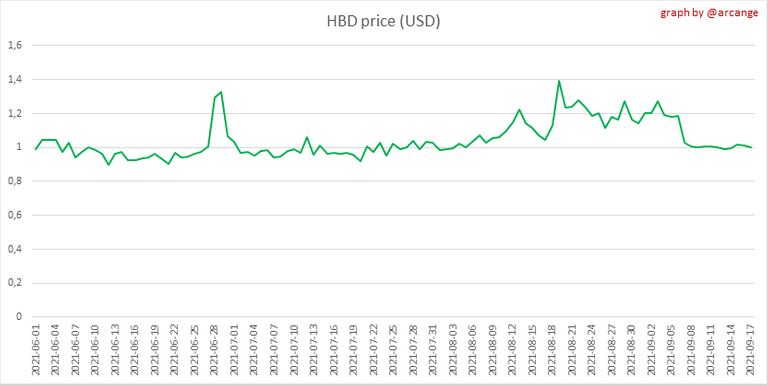 |
These graphs show the evolution of prices in USD for HIVE and HBD.
2. Supply
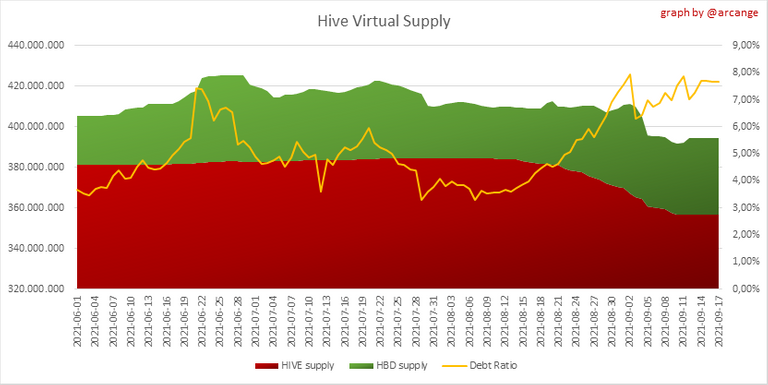
This graph shows the evolution of HIVE virtual Supply. The virtual supply is the sum of HIVE supply (liquid Or staked HIVE) and HBD supply (converted into HIVE).
The graph also displays the debt ratio (HBD supply / HIVE virtual supply). Keep in mind that since hardfork 24 funds in the treasury (@hive.fund HBD balance) don't count towards the HBD debt ratio.
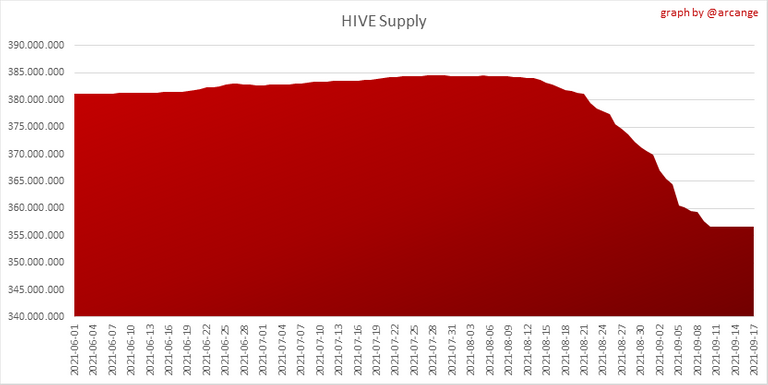 | 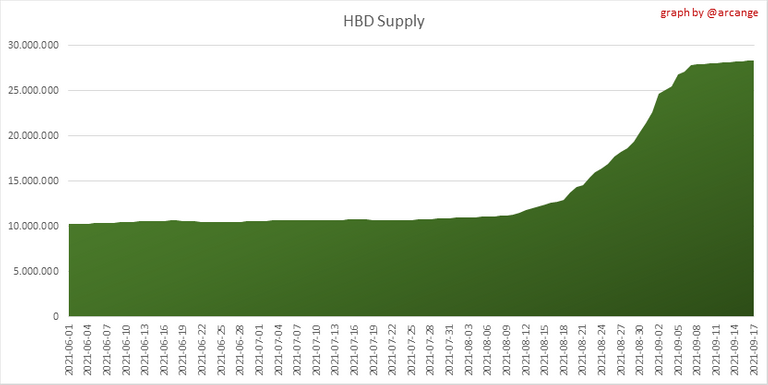 |
These graphs show the evolution of the HIVE Supply (both liquid and staked) and the HBD supply.
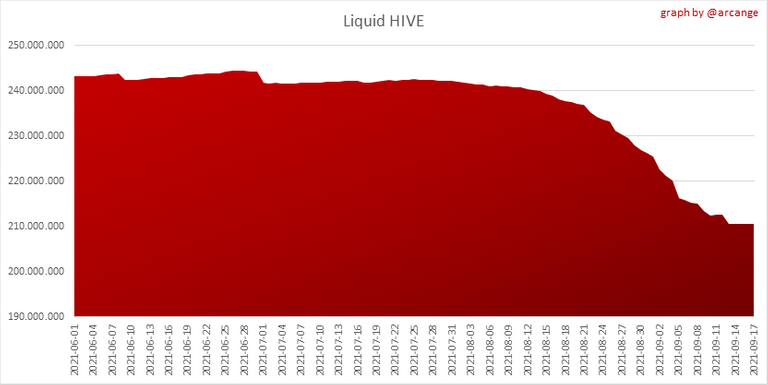 | 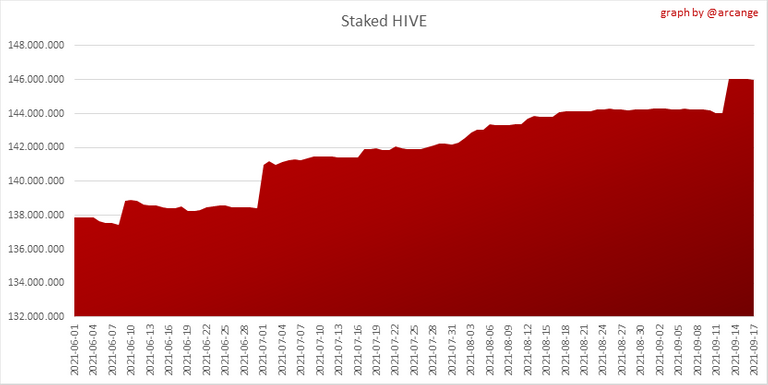 |
These charts show the evolution of the liquid HIVE and the staked HIVE (Hive Power).
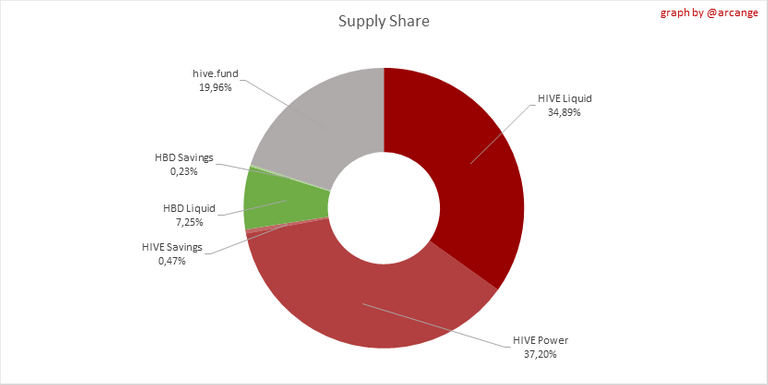
This graph shows the overall Hive tokens distribution.
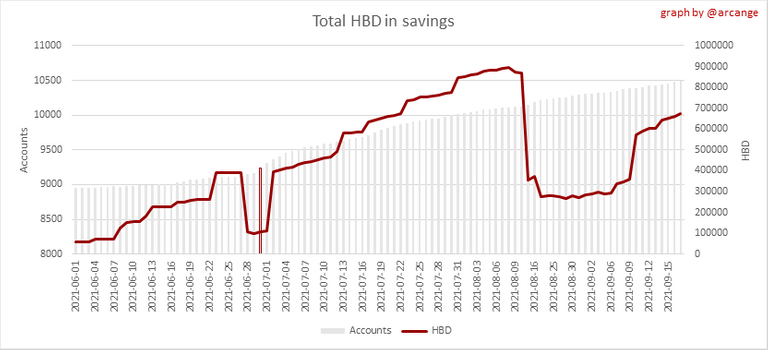
3. HBD Savings
Note: As of 2021-06-30 (HF25) interest is only paid for HBD which are stored in savings.
| Account | Deposit | Account | Withdrawal |
|---|---|---|---|
| @grot | 5,000.000 HBD | @hc2021.bodensee | 375.577 HBD |
| @demotruk | 2,361.000 HBD | @olu.acmbeats | 20.281 HBD |
| @penguinpablo | 1,500.000 HBD | @thaishps | 17.803 HBD |
| @seed-treasury | 798.482 HBD | @tibaire | 16.000 HBD |
| @votum | 336.921 HBD | @kittima | 13.351 HBD |
| @shroomfund | 158.327 HBD | @adamlaberenjena | 10.000 HBD |
| @badbitch | 117.089 HBD | @cryptoniusrex | 8.403 HBD |
| @cryptobrewmaster | 102.980 HBD | @palasatenea | 8.000 HBD |
| @flemingfarm | 100.000 HBD | @chaodietas | 7.898 HBD |
| @olgavita | 100.000 HBD | @arytonhive | 7.826 HBD |
This graph shows how much and how many accounts store HBD in savings. The table below shows the topmost HBD deposits and withdrawals of the day.

This chart shows the amount of interest paid each day for holding HBD and how many accounts received such interest.
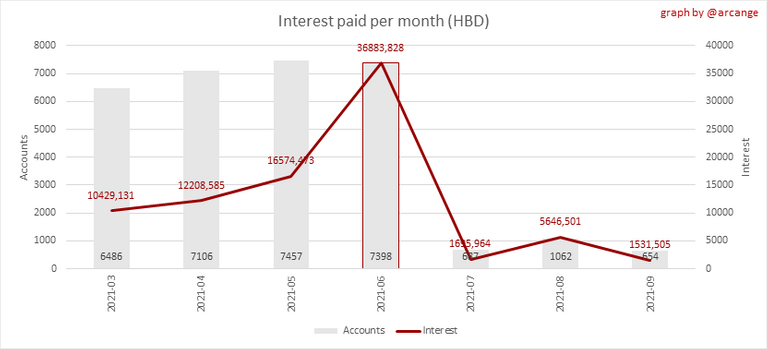
This chart is the same as the previous one, but data are grouped by month.
4. Balances
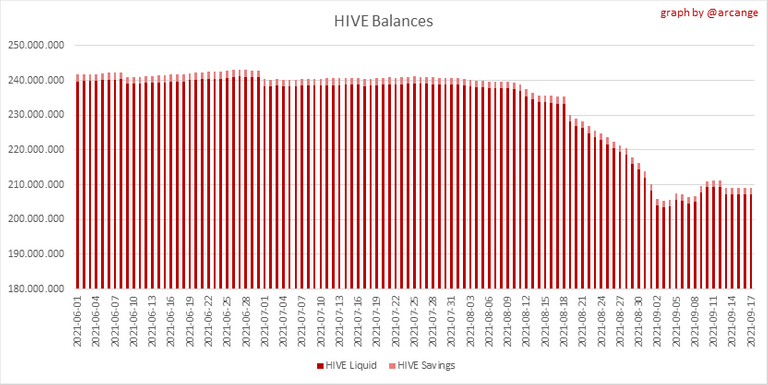
This graph shows the number of HIVE, both liquid and in savings, held by all accounts.

This graph shows the number of HBD, both liquid and in savings, held by all accounts.
5. Conversions
Note: As a reminder, conversion requests are only finalized after 3 days. It is only then that it is known exactly how many HIVE were burned in return for the HBD received at the time of the conversion request.
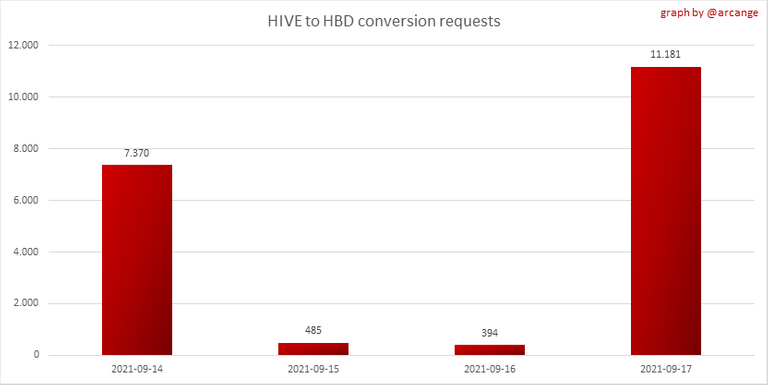
This graph shows the number of HIVE collateralized due to requests to convert HIVE to HBD over the past few days.
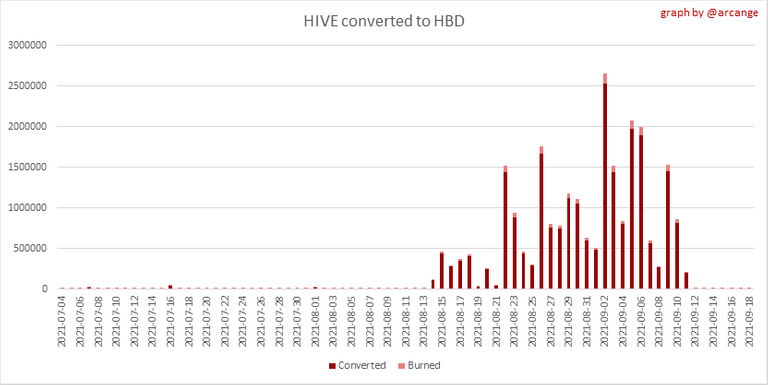 | 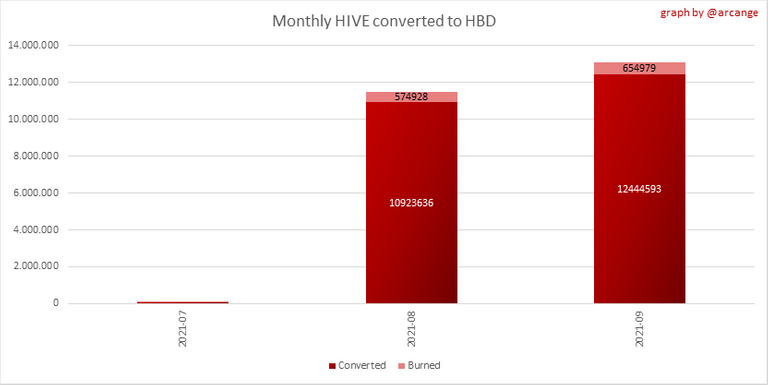 |
These graphs show the number of HIVE effectively used by the conversion process (HIVE converted and 5% HIVE fee which is burned) each day and month when requests to convert HIVE to HBD have been finalized.
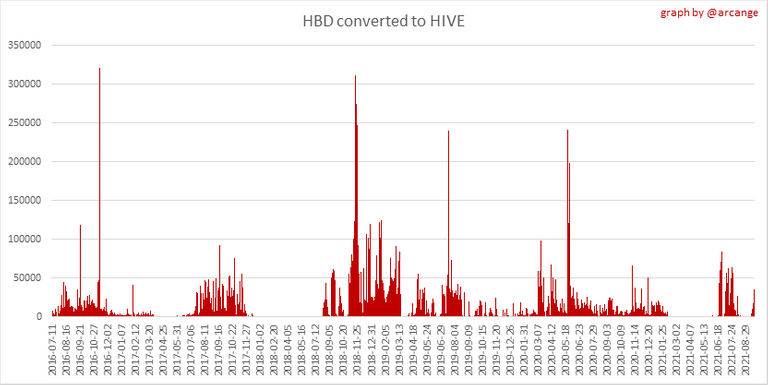 | 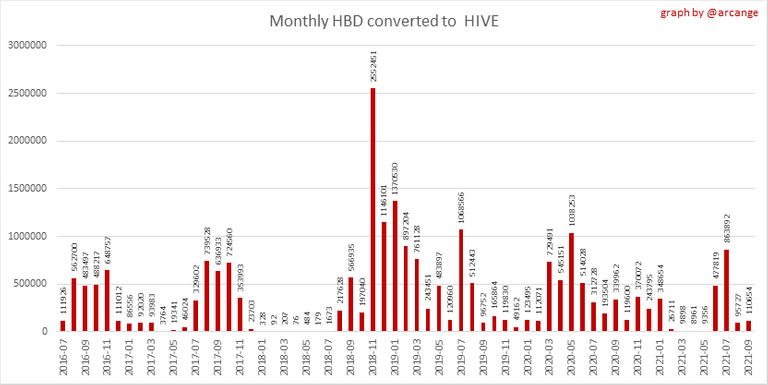 |
These graphs show the number of HBD burned, each day and each month, following requests to convert HBD to HIVE.
6. Powerup and Powerdown

| Date | Account | Amount |
|---|---|---|
| 2021-09-17 09:39:21 | @shralve | 29,303.565 HIVE |
| 2021-09-17 07:20:24 | @trangbaby | 7,098.211 HIVE |
| 2021-09-17 09:51:03 | @iptrucs | 5,637.510 HIVE |
| 2021-09-17 04:52:21 | @andrewmusic | 4,370.290 HIVE |
| 2021-09-17 03:27:36 | @votovzla | 3,239.110 HIVE |
| 2021-09-17 11:38:03 | @gabyjc | 2,744.175 HIVE |
| 2021-09-17 03:45:15 | @chittysity | 2,007.040 HIVE |
| 2021-09-17 08:28:09 | @positivesteem | 1,500.143 HIVE |
| 2021-09-17 07:27:39 | @knowhow92 | 1,370.301 HIVE |
| 2021-09-17 03:18:03 | @jhonny34 | 1,005.764 HIVE |
This graph and table show the amount of powerdown initiated over the last 7 days, and the largest initiated on this day.
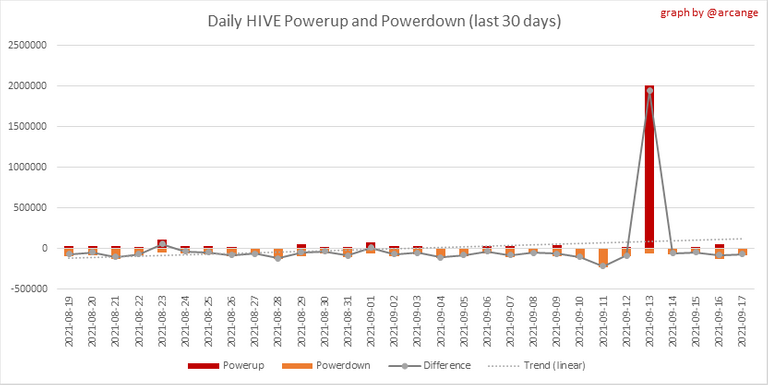
| Account | Powerup | Account | Powerdown |
|---|---|---|---|
| @vanje | 1,672.000 HIVE | @zioland | 18,211.265 HIVE |
| @wartrapa | 1,009.256 HIVE | @geneeverett | 4,075.049 HIVE |
| @tdre | 975.261 HIVE | @empoderat | 4,036.818 HIVE |
| @peakmonsters | 680.308 HIVE | @someguy123 | 3,099.963 HIVE |
| @abaraxtras | 603.733 HIVE | @jarvie | 2,794.763 HIVE |
| @utopis | 500.023 HIVE | @davidthompson57 | 2,772.485 HIVE |
| @sbi2 | 435.197 HIVE | @soyrosa | 2,713.530 HIVE |
| @saltyreptile | 396.000 HIVE | @cardanoguru | 2,589.168 HIVE |
| @dikayskate | 240.000 HIVE | @sog13 | 2,537.162 HIVE |
| @orinoco | 237.339 HIVE | @deanliu | 2,027.543 HIVE |
This graph shows the daily HIVE power-up, power-down, and the resulting variation over the last 30 days. The table shows the topmost power-ups and power-downs of the day.
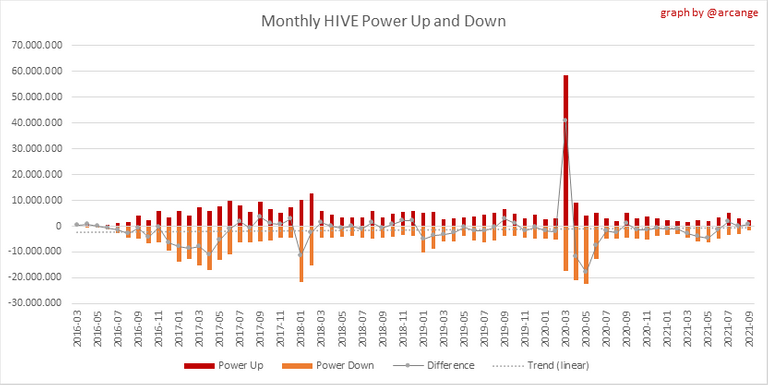
This graph shows the monthly HIVE power-up, power-down and the resulting variation.
Values for the last 3 months
| Period | Powerup | Powerdown | Difference |
|---|---|---|---|
| 2021-09 | 1,654,269.000 | 2,383,112.000 | 728,843.000 |
| 2021-08 | 3,144,598.000 | 3,212,814.000 | 68,216.000 |
| 2021-07 | 3,415,366.000 | 5,186,384.000 | 1,771,018.000 |
7. Transfers
These graphs show the volume (in USD) of HIVE and HBD transferred between accounts.
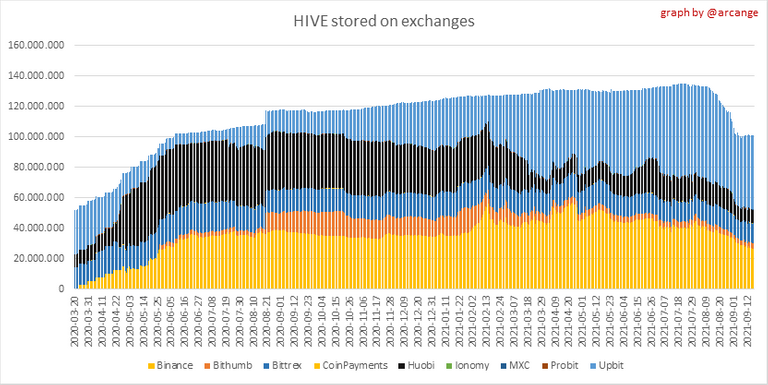
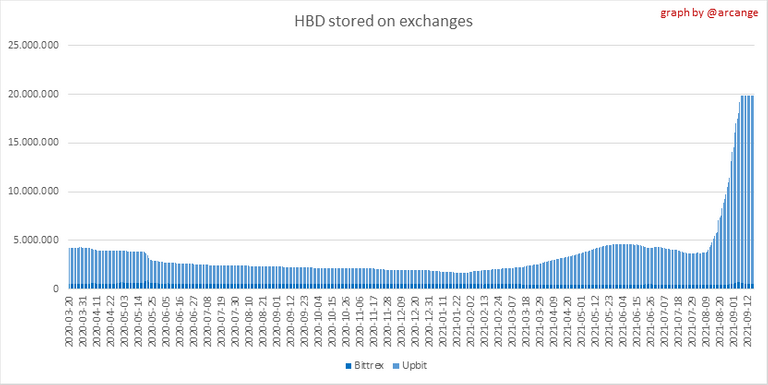
8. Exchanges
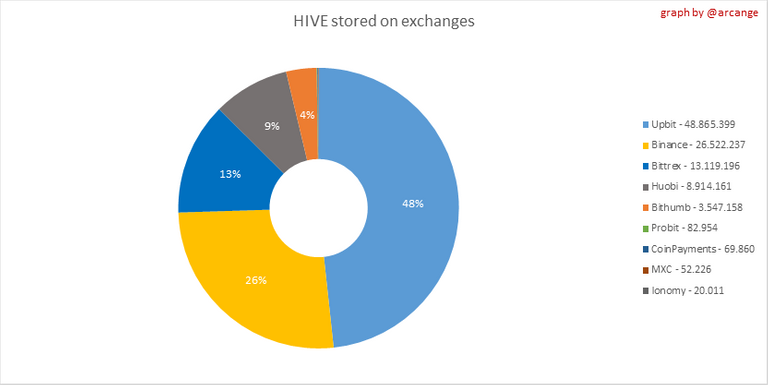 | 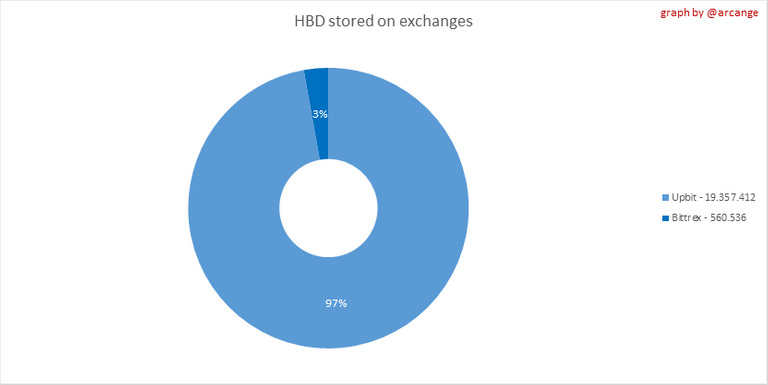 |
These graphs show the amount and distribution of HIVE and HBD stored on the exchanges where they are listed.
 |  |
These graphs show the daily evolution of HIVE and HBD stored on the exchanges where they are listed.
I hope you find those stats useful. If you would like to see additional stats, feel free to drop me a comment. Your feedback is than welcome.
Thanks for reading.
Check out my apps and services


You need to stake more BEER (24 staked BEER allows you to call BEER one time per day)
Nice write up!
Thank you @saltyreptile
$WINE
Congratulations, @theguruasia You Successfully Shared 0.400 WINE With @arcange.
You Earned 0.400 WINE As Curation Reward.
You Utilized 4/5 Successful Calls.
Contact Us : WINE Token Discord Channel
WINE Current Market Price : 0.198
Love hive token