
Welcome to the daily financial report about the Hive blockchain.
All the information presented in this report is based on the data collected from the blockchain until 2022-04-13 midnight UTC. This report aims to provide you with a clear view of what is happening on the Hive blockchain.
 Este post está traducido al español - aquí
 Dieser Beitrag ist ins Deutsche übersetzt - hier
 Une version en français de ce post est disponible - ici
1. Price
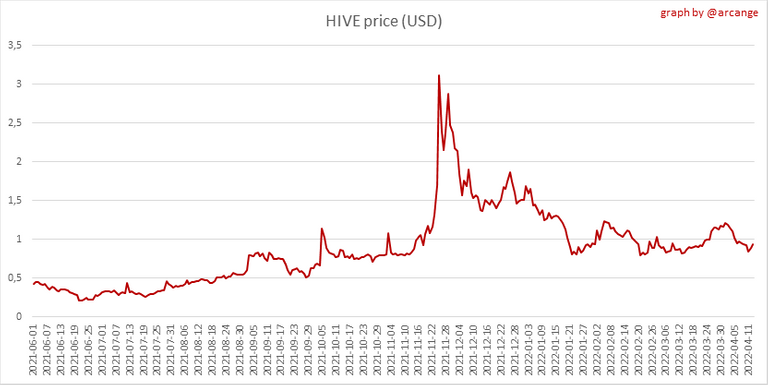 | 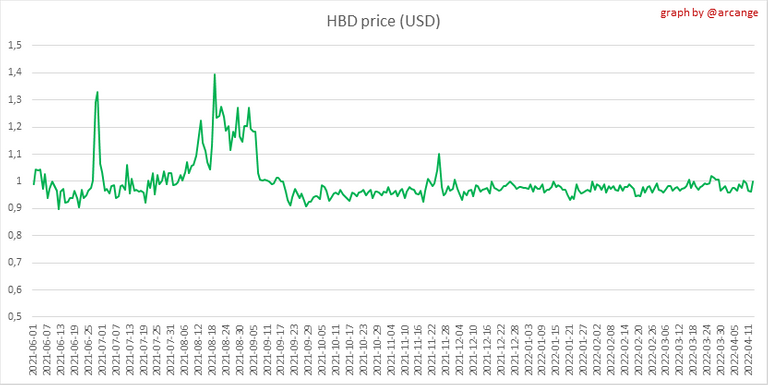 |
These graphs show the evolution of prices in USD for HIVE and HBD.
2. Supply
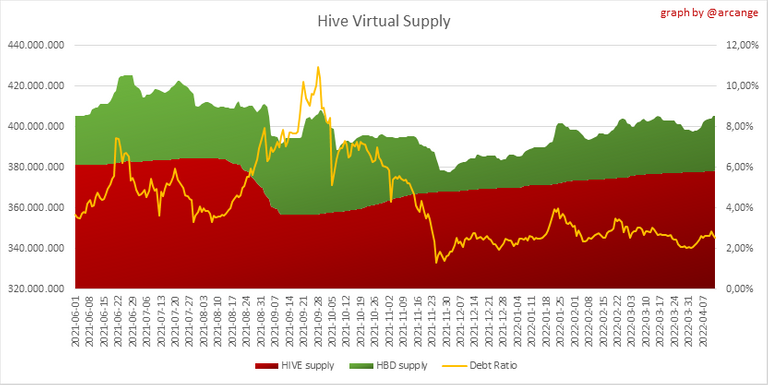
This graph shows the evolution of HIVE virtual Supply. The virtual supply is the sum of HIVE supply (liquid and staked HIVE) and HBD supply (converted into HIVE).
The graph also displays the debt ratio (HBD supply / HIVE virtual supply). Keep in mind that since hardfork 24 funds in the treasury (@hive.fund HBD balance) don't count towards the HBD debt ratio.
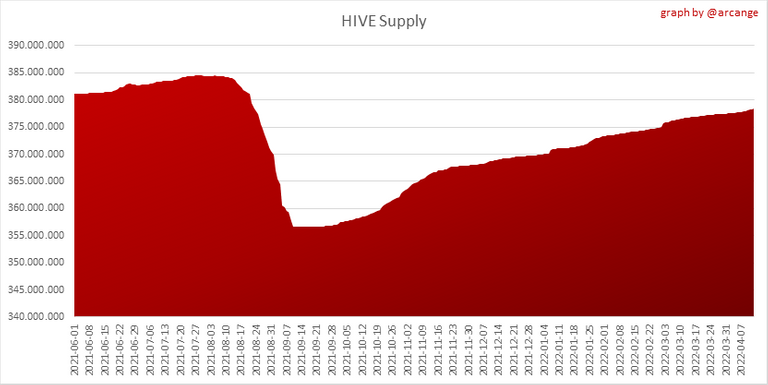 | 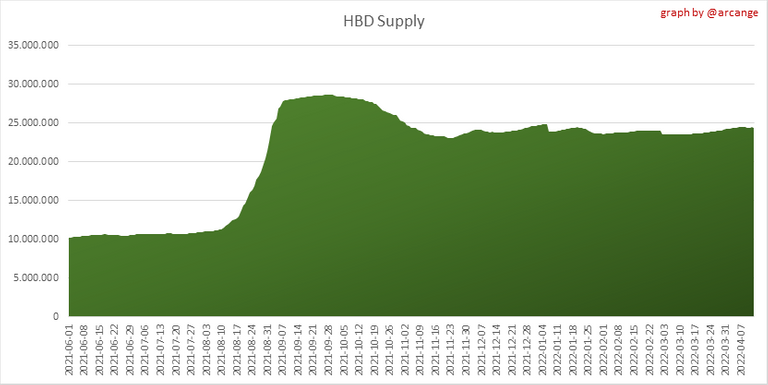 |
These graphs show the evolution of the HIVE Supply (both liquid and staked) and the HBD supply.
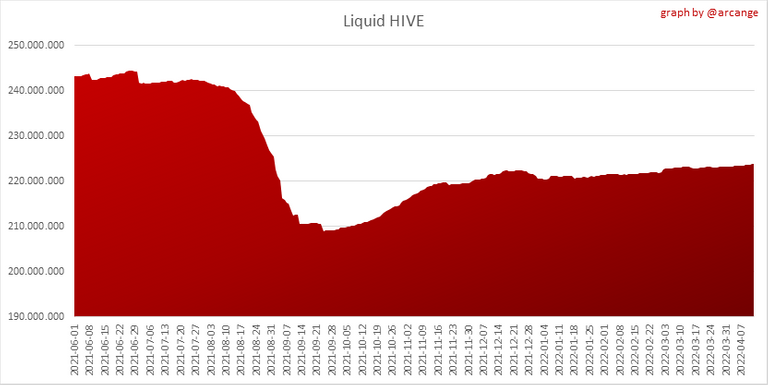 | 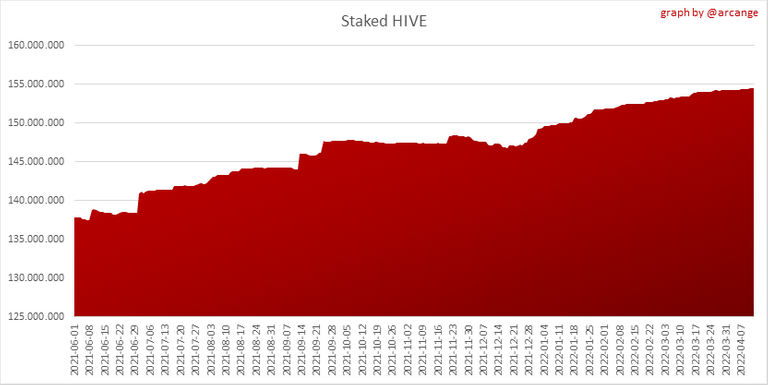 |
These charts show the evolution of the liquid HIVE and the staked HIVE (Hive Power).
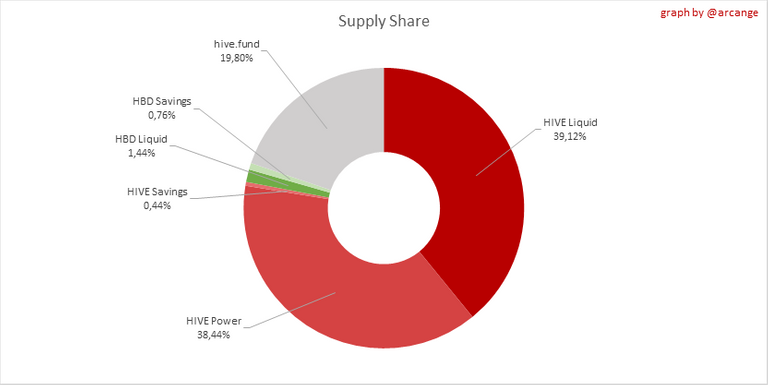
This graph shows the overall Hive tokens distribution.
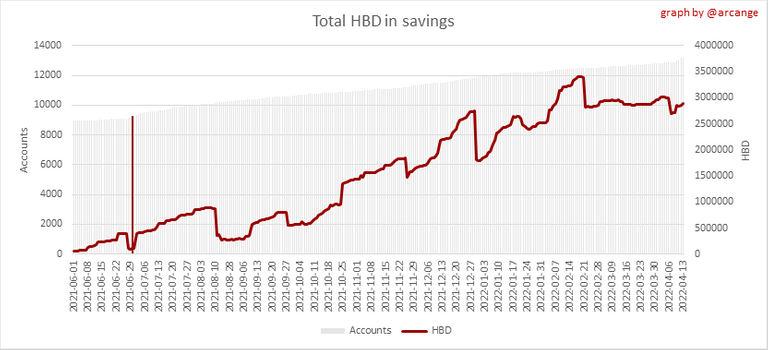
3. HBD Savings
| Account | Deposit | Account | Withdrawal |
|---|---|---|---|
| @hiddenblade | 9,974.422 HBD | @city-of-dresden | 678.150 HBD |
| @dwayne16 | 4,091.320 HBD | @themyscira | 242.245 HBD |
| @mahdiyari | 3,000.690 HBD | @nupulse | 190.008 HBD |
| @nuttin | 2,992.499 HBD | @hivevault | 82.519 HBD |
| @sourovafrin | 2,322.053 HBD | @steemvault | 66.012 HBD |
| @risingstarhub | 1,604.126 HBD | @empoderat | 65.000 HBD |
| @dragosroua | 1,000.577 HBD | @portalmine | 54.567 HBD |
| @jaster | 990.000 HBD | @anthony2019 | 50.000 HBD |
| @grapthar | 602.047 HBD | @bifbeans | 43.712 HBD |
| @kheldar1982a | 594.000 HBD | @beta500 | 24.700 HBD |
This graph shows how much and how many accounts store HBD in savings. The table below shows the topmost HBD deposits and withdrawals of the day.
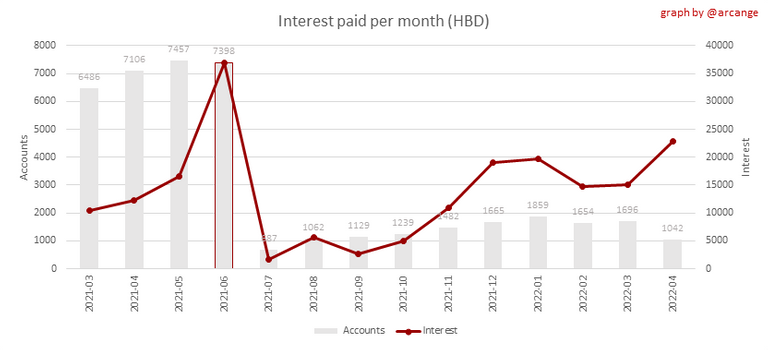
Note: As of 2021-06-30 (HF25) interest is only paid for HBD which are stored in savings.
This chart shows the amount of interest paid each month for holding HBD and how many accounts received such interest.
4. Balances
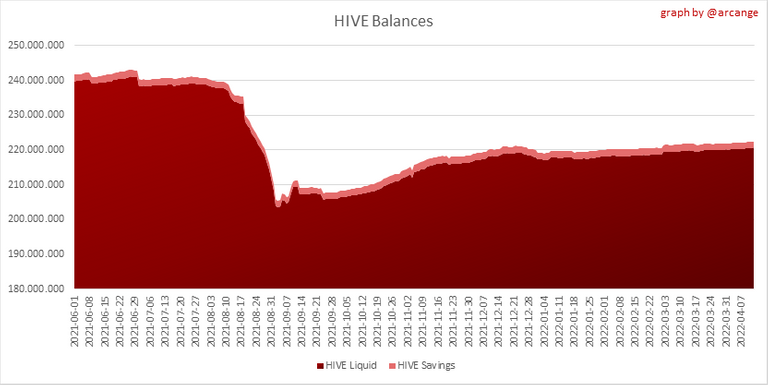
This graph shows the number of HIVE, both liquid and in savings, held by all accounts.
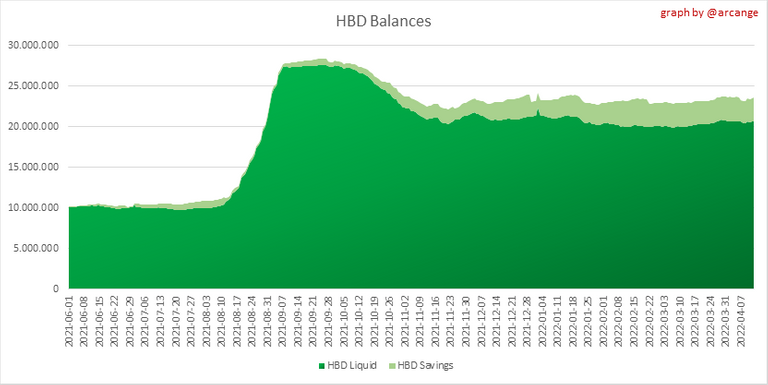
This graph shows the number of HBD, both liquid and in savings, held by all accounts.
5. Conversions
Note: As a reminder, conversion requests are only finalized after 3 days. It is only then that it is known exactly how many HIVE were burned in return for the HBD received at the time of the conversion request.
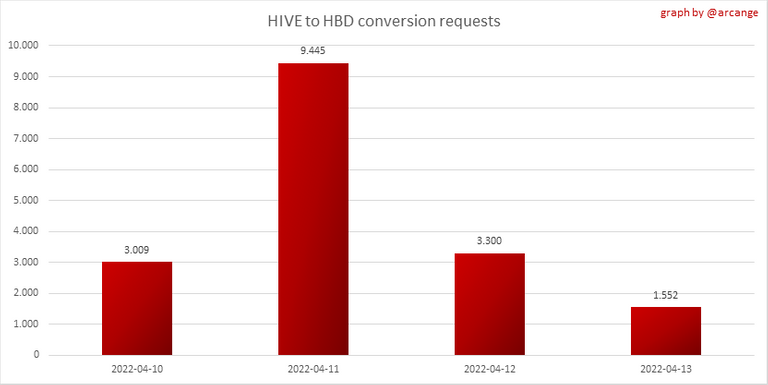
This graph shows the number of HIVE collateralized due to requests to convert HIVE to HBD over the past few days.
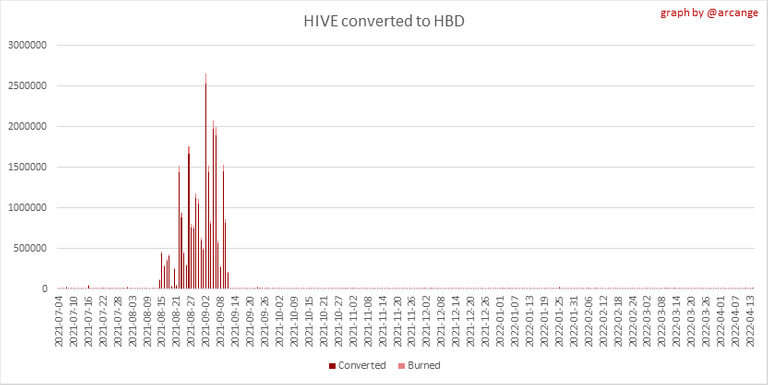 | 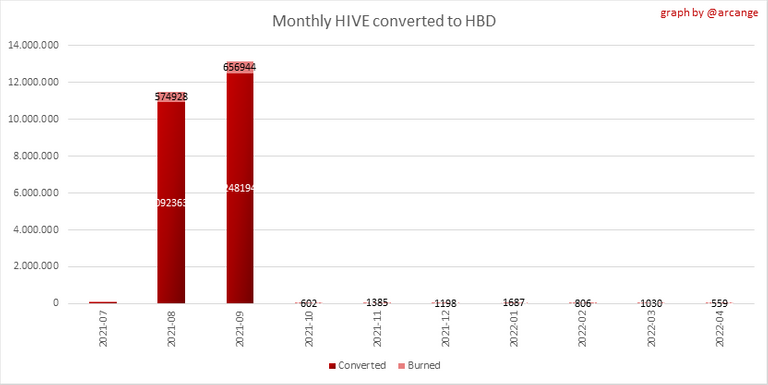 |
These graphs show the number of HIVE effectively used by the conversion process (HIVE converted and 5% HIVE fee which is burned) each day and month when requests to convert HIVE to HBD have been finalized.
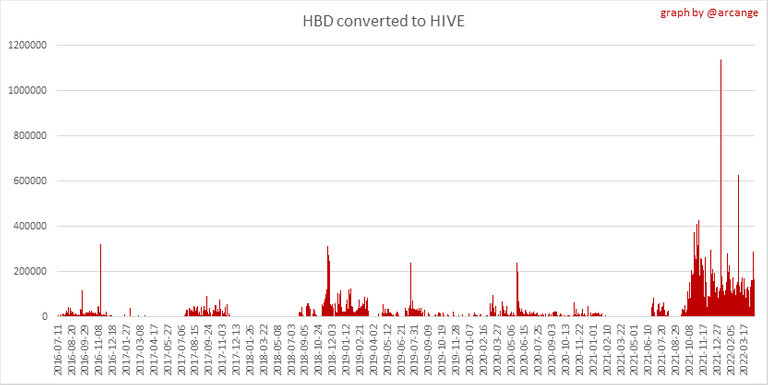 | 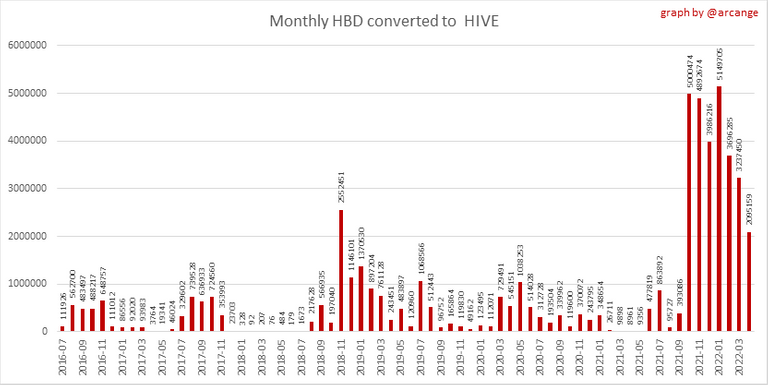 |
These graphs show the number of HBD burned, each day and each month, following requests to convert HBD to HIVE.
6. Powerup and Powerdown
| Date | Account | Amount |
|---|---|---|
| 2022-04-13 10:53:15 | @kiemis | 17,922.291 HIVE |
| 2022-04-13 08:53:42 | @road2horizon | 7,618.127 HIVE |
| 2022-04-13 11:53:21 | @dmilliz | 6,457.444 HIVE |
| 2022-04-13 10:50:33 | @ambyr00 | 6,055.437 HIVE |
| 2022-04-13 10:48:21 | @ninnu | 5,410.391 HIVE |
| 2022-04-13 10:10:36 | @iot-blocks | 5,000.177 HIVE |
| 2022-04-13 10:49:42 | @gamer00 | 3,406.246 HIVE |
| 2022-04-13 06:04:57 | @gabrielatravels | 3,288.288 HIVE |
| 2022-04-13 02:59:00 | @gleam-of-light | 1,787.033 HIVE |
| 2022-04-13 03:36:48 | @indayclara | 1,275.130 HIVE |
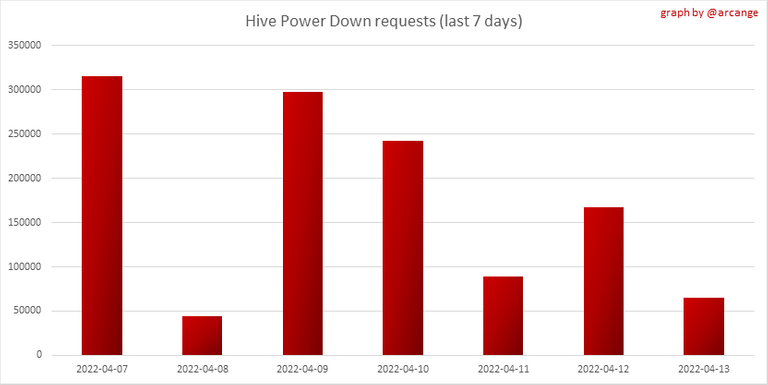
This graph and table show the amount of powerdown initiated over the last 7 days, and the largest initiated on this day.
| Account | Powerup | Account | Powerdown |
|---|---|---|---|
| @jphamer1 | 2,149.990 HIVE | @nathansenn | 5,910.298 HIVE |
| @eythorphoto | 1,000.500 HIVE | @ocd-witness | 3,317.721 HIVE |
| @balte | 675.000 HIVE | @acidyo | 1,796.897 HIVE |
| @becca-mac | 551.837 HIVE | @mawit07 | 1,545.176 HIVE |
| @blrog | 525.295 HIVE | @spk.beneficiary | 1,328.724 HIVE |
| @kubak | 495.000 HIVE | @cooltivar | 1,181.645 HIVE |
| @d8niel77 | 483.384 HIVE | @elgeko | 1,160.143 HIVE |
| @torem-di-torem | 348.636 HIVE | @reward.app | 1,010.646 HIVE |
| @venarisyndicate | 262.177 HIVE | @catwomanteresa | 878.591 HIVE |
| @superlotto | 247.000 HIVE | @amirl | 859.522 HIVE |
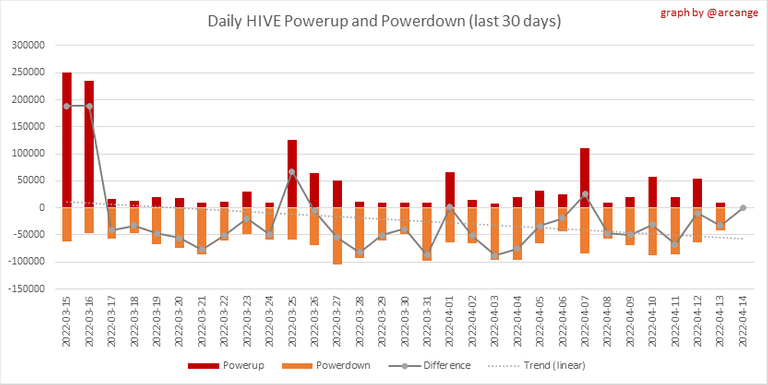
This graph shows the daily HIVE power-up, power-down, and the resulting variation over the last 30 days. The table shows the topmost power-ups and power-downs of the day.
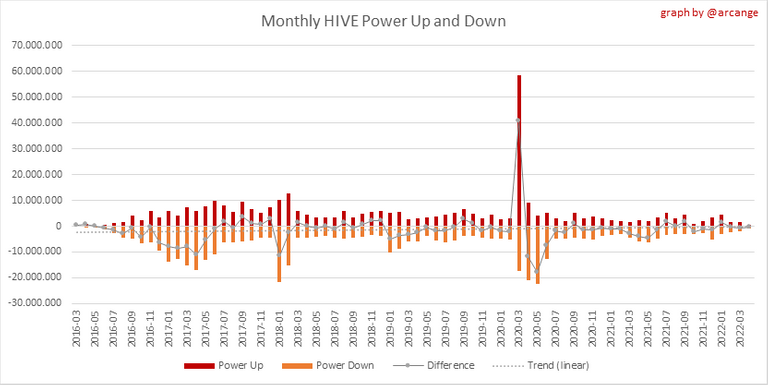
This graph shows the monthly HIVE power-up, power-down and the resulting variation.
Values for the last 3 months
| Period | Powerup | Powerdown | Difference |
|---|---|---|---|
| 2022-04 | 443,114.000 | 920,328.000 | -477,214.000 |
| 2022-03 | 1,495,982.000 | 2,097,310.000 | -601,328.000 |
| 2022-02 | 1,749,531.000 | 2,228,644.000 | -479,113.000 |
7. Transfers
These graphs show the volume (in USD) of HIVE and HBD transferred between accounts.
8. Exchanges
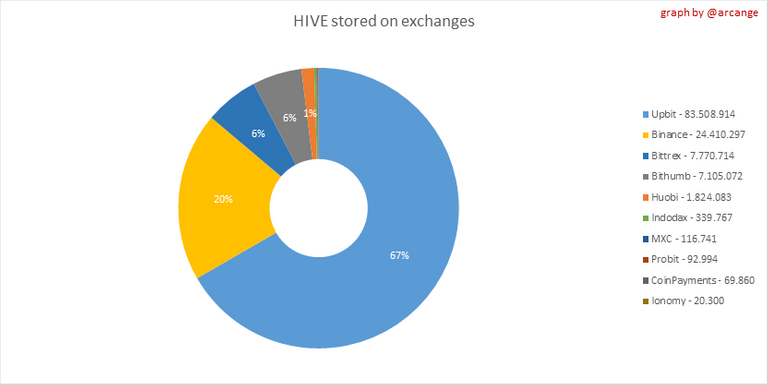 | 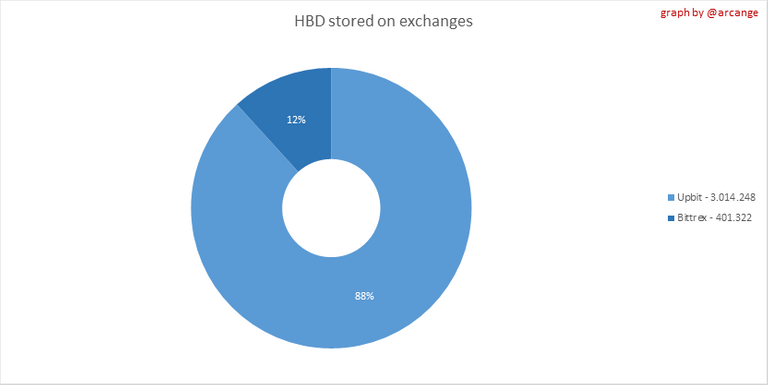 |
These graphs show the amount and distribution of HIVE and HBD stored on the exchanges where they are listed.
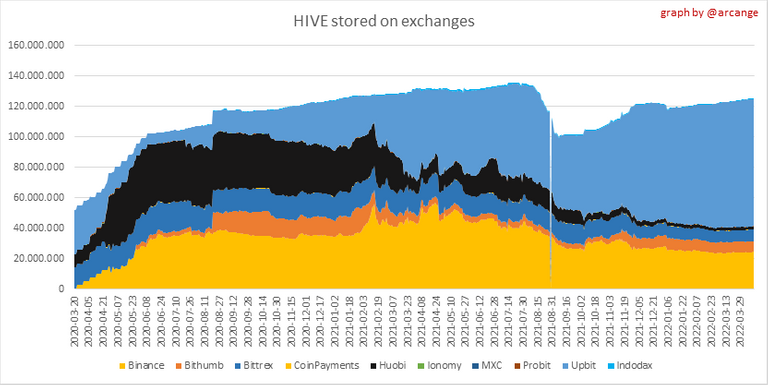 | 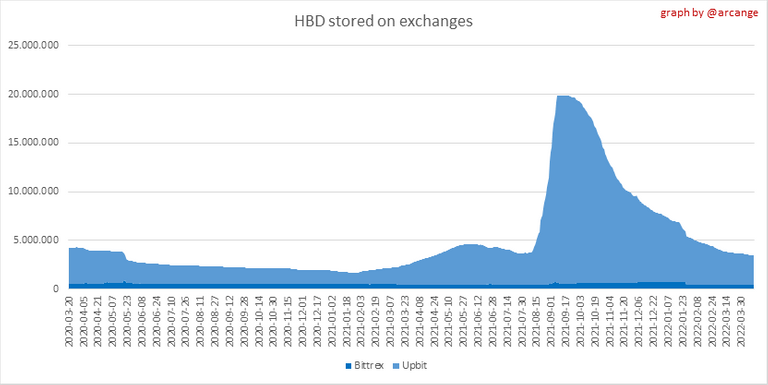 |
These graphs show the daily evolution of HIVE and HBD stored on the exchanges where they are listed.
I hope you find those stats useful. If you would like to see additional stats, feel free to drop me a comment. Your feedback is than welcome.
Thanks for reading.
Check out my apps and services


Interesting numbers and I was waiting for them to see the impact of 20% APR on HBD Savings. I think at the moment it didn't move too much, but probably in the future, the numbers will grow from here. I except more HBD to be added to the savings, maybe more supply on it and hopefully the Hive price to increase like Terra LUNA did ;))
Posted Using LeoFinance Beta
$WINE
Congratulations, @theguruasia You Successfully Shared 0.300 WINEX With @arcange.
You Earned 0.300 WINEX As Curation Reward.
You Utilized 3/3 Successful Calls.
Contact Us : WINEX Token Discord Channel
WINEX Current Market Price : 0.250
Swap Your Hive <=> Swap.Hive With Industry Lowest Fee (0.1%) : Click This Link
Read Latest Updates Or Contact Us