
Welcome to the daily financial report about the Hive blockchain.
All the information presented in this report is based on the data collected from the blockchain until 2022-10-19 midnight UTC. This report aims to provide you with a clear view of what is happening on the Hive blockchain.
 Este post está traducido al español - aquí
 Dieser Beitrag ist ins Deutsche übersetzt - hier
 Une version en français de ce post est disponible - ici
1. Price
 |  |
These graphs show the evolution of prices in USD for HIVE and HBD.
2. Supply

This graph shows the evolution of HIVE virtual Supply. The virtual supply is the sum of HIVE supply (liquid and staked HIVE) and HBD supply (converted into HIVE).
The graph also displays the debt ratio (HBD supply / HIVE virtual supply). Keep in mind that since hardfork 24 funds in the treasury (@hive.fund HBD balance) don't count towards the HBD debt ratio.
 |  |
These graphs show the evolution of the HIVE Supply (both liquid and staked) and the HBD supply.
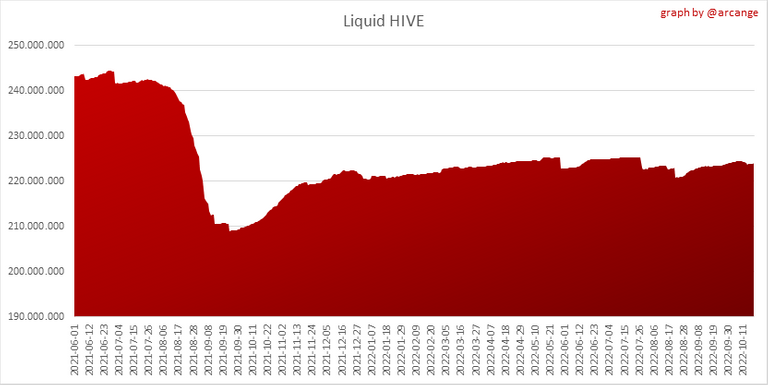 |  |
These charts show the evolution of the liquid HIVE and the staked HIVE (Hive Power).

This graph shows the overall Hive tokens distribution.
3. HBD Savings

| Account | Deposit | Account | Withdrawal |
|---|---|---|---|
| @resiliencia | 1,700.000 HBD | @walterjay | 1,054.701 HBD |
| @amico | 590.390 HBD | @arlettemsalase | 730.000 HBD |
| @invest4free | 581.741 HBD | @matheusggr | 609.063 HBD |
| @libertycrypto27 | 476.745 HBD | @nostalgic1212 | 200.000 HBD |
| @klye | 404.685 HBD | @dhub | 164.426 HBD |
| @hiveauth | 338.525 HBD | @gadrian | 46.000 HBD |
| @howo | 330.000 HBD | @alyssasanders | 45.791 HBD |
| @thetroublenotes | 290.742 HBD | @vrezyy | 36.628 HBD |
| @hivechain.app | 197.900 HBD | @toofast-ace | 32.882 HBD |
| @shitsignals | 150.542 HBD | @danielhuhservice | 30.950 HBD |
This graph shows how much and how many accounts store HBD in savings. The table below shows the topmost HBD deposits and withdrawals of the day.

Note: As of 2021-06-30 (HF25) interest is only paid for HBD which are stored in savings.
This chart shows the amount of interest paid each month for holding HBD and how many accounts received such interest.
4. Balances

This graph shows the number of HIVE, both liquid and in savings, held by all accounts.

This graph shows the number of HBD, both liquid and in savings, held by all accounts.
5. Conversions
Note: As a reminder, conversion requests are only finalized after 3 days. It is only then that it is known exactly how many HIVE were burned in return for the HBD received at the time of the conversion request.

This graph shows the number of HIVE collateralized due to requests to convert HIVE to HBD over the past few days.
 |  |
These graphs show the number of HIVE effectively used by the conversion process (HIVE converted and 5% HIVE fee which is burned) each day and month when requests to convert HIVE to HBD have been finalized.
 |  |
These graphs show the number of HBD burned, each day and each month, following requests to convert HBD to HIVE.
6. Powerup and Powerdown

| Date | Account | Amount |
|---|---|---|
| 2022-10-19 06:22:24 | @aliento | 10,793.130 HIVE |
| 2022-10-19 09:53:48 | @skenderbeu | 9,510.350 HIVE |
| 2022-10-19 12:33:36 | @cervantes | 7,079.352 HIVE |
| 2022-10-19 06:21:57 | @eddiespino | 6,335.610 HIVE |
| 2022-10-19 02:29:48 | @croupierbot | 3,164.630 HIVE |
| 2022-10-19 08:49:57 | @lecumberre | 2,600.105 HIVE |
| 2022-10-19 06:23:03 | @aliento.love | 2,510.121 HIVE |
| 2022-10-19 05:48:21 | @acesontop | 2,149.108 HIVE |
| 2022-10-19 10:09:06 | @oluwoleolaide | 2,083.567 HIVE |
| 2022-10-19 12:21:48 | @fionasfavourites | 2,075.851 HIVE |
This graph and table show the amount of powerdown initiated over the last 7 days, and the largest initiated on this day.

| Account | Powerup | Account | Powerdown |
|---|---|---|---|
| @emrebeyler | 3,094.000 HIVE | @michealb | 3,539.677 HIVE |
| @a04 | 1,500.000 HIVE | @ausbitbank | 2,252.143 HIVE |
| @incublus | 709.136 HIVE | @samuel-swinton | 1,868.647 HIVE |
| @howzat | 620.965 HIVE | @reseller | 1,573.229 HIVE |
| @aljif7 | 521.122 HIVE | @ambicrypto | 1,557.311 HIVE |
| @tonyz | 507.000 HIVE | @uwelang | 1,347.389 HIVE |
| @demotruk | 373.154 HIVE | @onealfa | 1,313.687 HIVE |
| @acesontop | 268.992 HIVE | @guiltyparties | 1,234.794 HIVE |
| @ahmetay | 250.019 HIVE | @ace108 | 846.074 HIVE |
| @bilgin70 | 245.858 HIVE | @spk.beneficiary | 801.135 HIVE |
This graph shows the daily HIVE power-up, power-down, and the resulting variation over the last 30 days. The table shows the topmost power-ups and power-downs of the day.

This graph shows the monthly HIVE power-up, power-down and the resulting variation.
Values for the last 3 months
| Period | Powerup | Powerdown | Difference |
|---|---|---|---|
| 2022-10 | 375,829.000 | 1,290,658.000 | -914,829.000 |
| 2022-09 | 677,489.000 | 1,911,436.000 | -1,233,947.000 |
| 2022-08 | 1,761,089.000 | 1,841,009.000 | -79,920.000 |
7. Transfers
These graphs show the volume (in USD) of HIVE and HBD transferred between accounts.
8. Exchanges
 |  |
These graphs show the amount and distribution of HIVE and HBD stored on the exchanges where they are listed.
 |  |
These graphs show the daily evolution of HIVE and HBD stored on the exchanges where they are listed.
I hope you find those stats useful. If you would like to see additional stats, feel free to drop me a comment. Your feedback is than welcome.
Thanks for reading.
Check out my apps and services


Can I ask you a question? Can anyone of you, please tell, when will be able again HIVE on Binance? Now is suspended, and I need to know when would I'll be can exchange and trade with it... Thanks
That's a good question, which I'm interested, too.
Only Binance knows
The only ones who can answer this question are the folks at Binance.
I see growing numbers and consolidation on the HBD Savings. Guess users feel safe enough to put HBD aside for a good 20% APR straight from the wallet. We need more financial instruments in the Hive blockchain supported at the infrastructure level to encourage a serious finance domain to be built within.
Posted Using LeoFinance Beta
I fully agree.
BTW, may I ask you to support the new Hive Authentication Services proposal (#240) so I can continue to improve and maintain HiveAuth?
You can do it for on Peakd, ecency,
Thank you!
Thanks for keeping us posted 👌🏽
You're welcome @growandbow
!Hiqvote