
Welcome to the daily analytical report about the Hive blockchain.
All the information presented in this report is based on the data collected from the blockchain until 2024-01-25 midnight UTC. This report aims to provide you with a clear view of what is happening on the Hive blockchain.
 Este post está traducido al español - aquí
 Dieser Beitrag ist ins Deutsche übersetzt - hier
 Une version en français de ce post est disponible - ici
1. New users
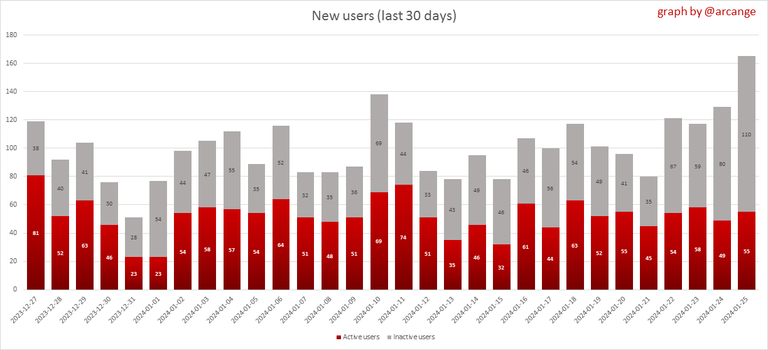
This chart shows the number of newly registered users on the blockchain and how many of them became active. The chart is kind of dynamic! A user can register one day and become active a few days later. Therefore, the number of active users on a specific date may change from day to day.
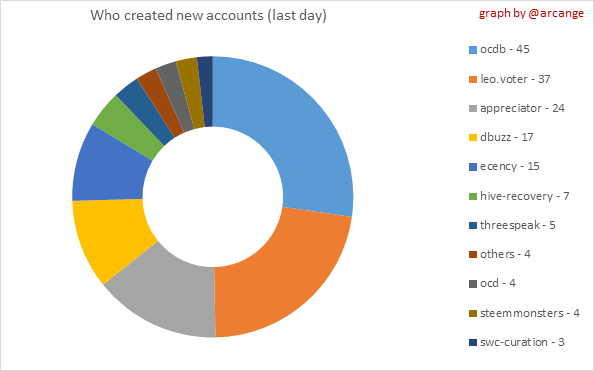 | 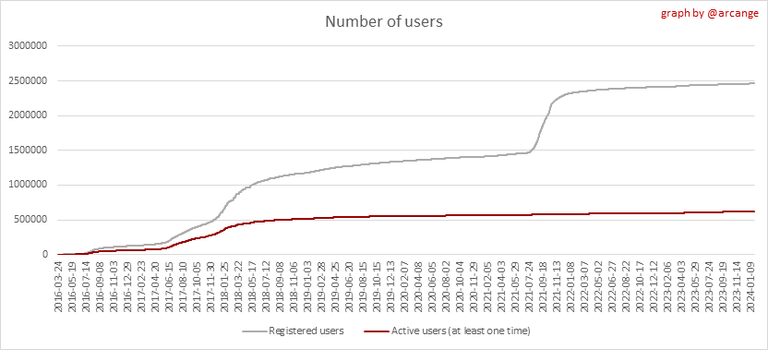 |
These two graphs show who created new accounts during the last day and the total number of registered accounts. The red line shows how many of them have been active at least once (active meaning publishing a post, commenting or voting). They are included even if they become inactive later.
2. Active users
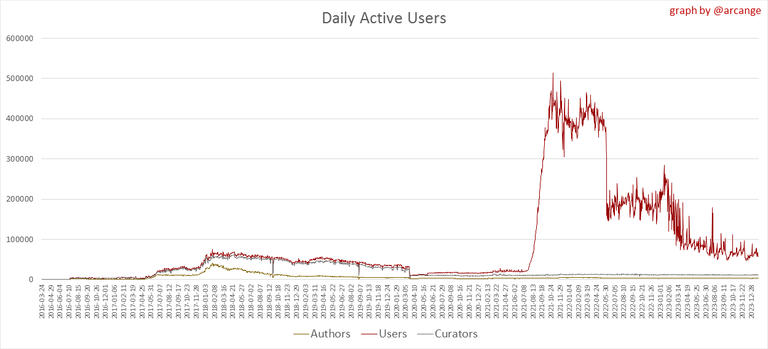 | 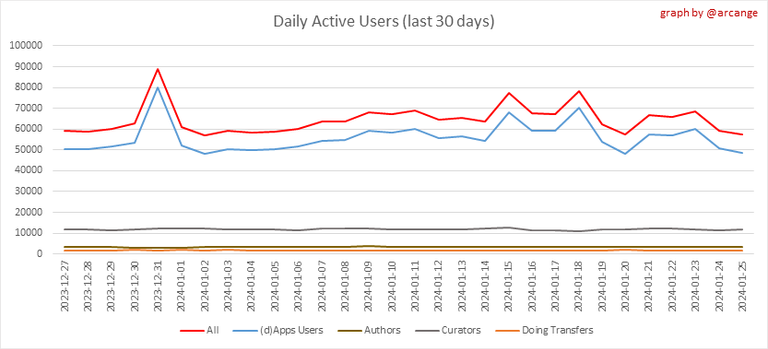 |
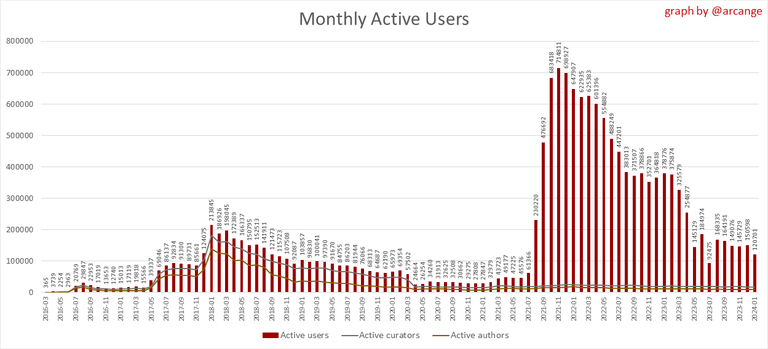
These graphs show the activity of users over time and in more detail the last 30 days. In these graphs, "active users" are those performing any type of transaction on the blockchain.
The last graph is a monthly summary of the active users. Be careful when interpreting the value of the last column which can be much lower if the end of the month has not yet been reached.
3. Apps

This graph shows which applications are most used to publish posts and comments. Please note that the same user can use several different applications.
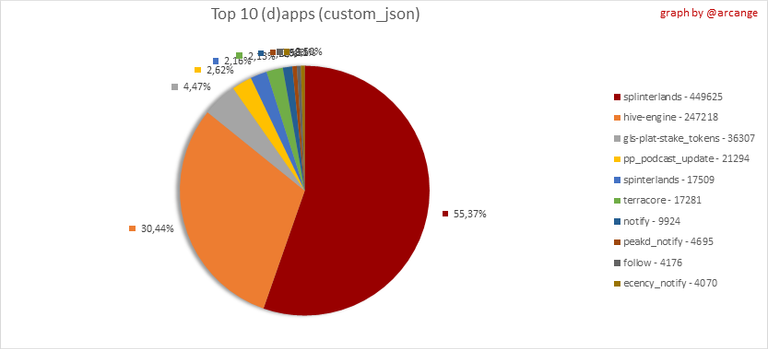
This graph shows which applications generate the most activity (custom_json operations) on the blockchain.
4. Posts And comments
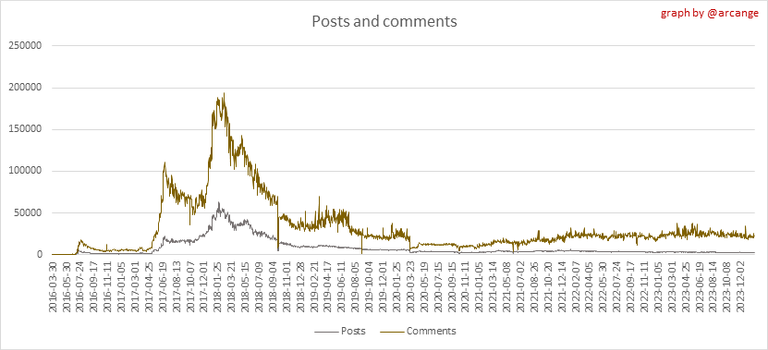 | 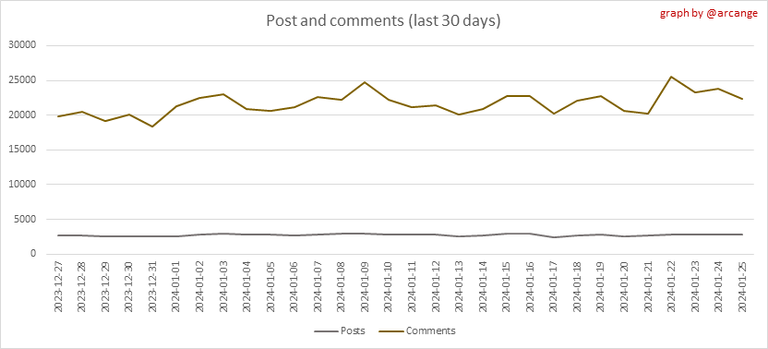 |
These graphs show the evolution of posts and comments for the whole blockchain lifetime and the last 30 days.
5. Curation
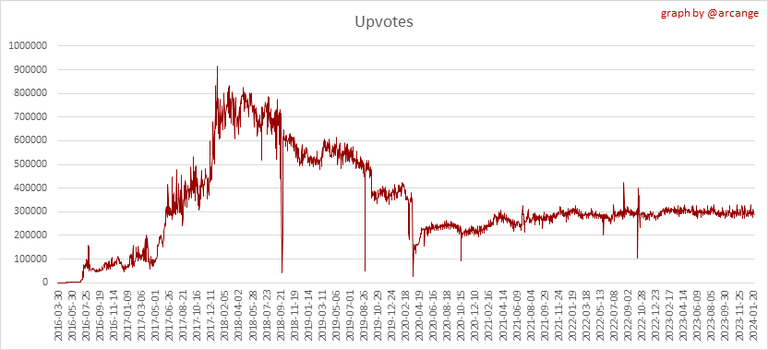 | 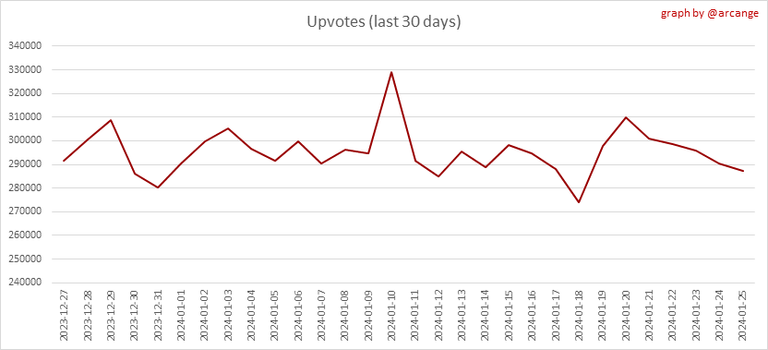 |
These graphs show the evolution of curation (upvotes) for the whole blockchain lifetime and the last 30 days.
6. Daily transactions
![]()
These graphs show the number of transactions per day, and the highest number of transactions per block, the average number of transactions per block, and the number of transactions per block for the last 48 hours. This gives you an idea of the whole activity on the blockchain.
![]()
This graph shows the distribution of the top 10 types of transactions by number of operations performed on the blockchain.
7. Communities and Tags
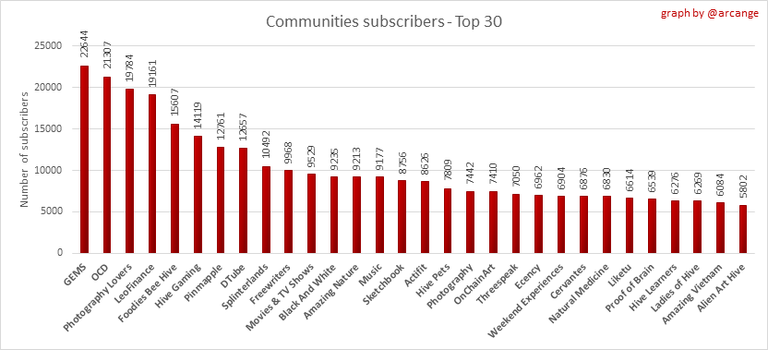
This graph shows the communities with the most subscribers.
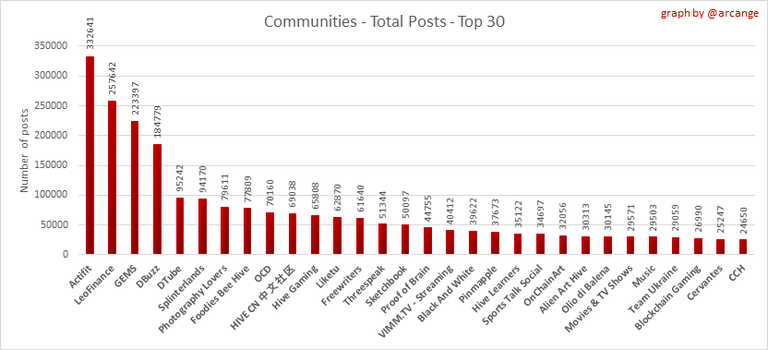 | 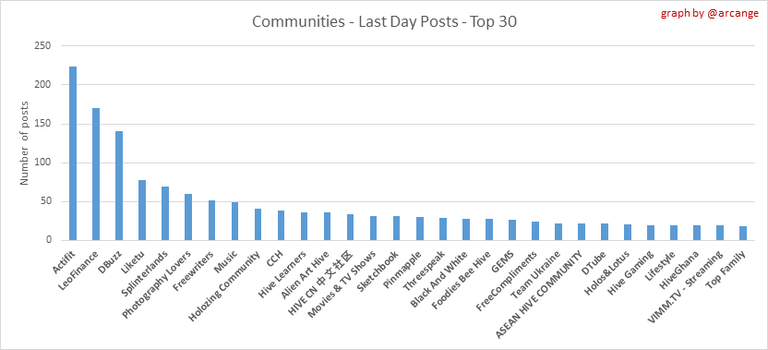 |
These graphs show the most active communities by number of posts (blockchain lifetime and last day).
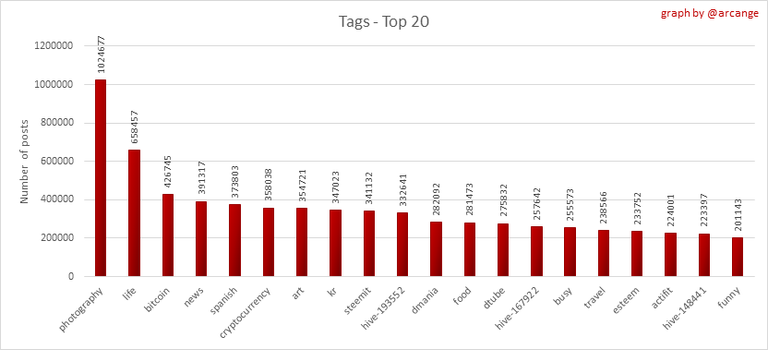 | 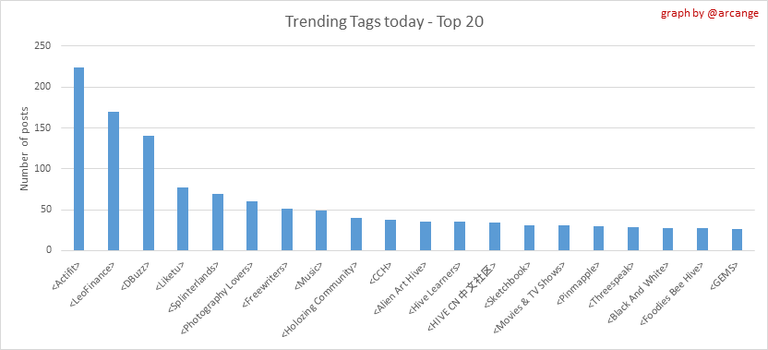 |
These graphs show which main tags have been the most used for publishing posts for the whole blockchain lifetime and the last day.
8. Distribution
 |  |  |  |  |
| < ~575 HP | >= ~575 HP | >= ~5745 HP | >= ~57443 HP | >= ~574423 HP |
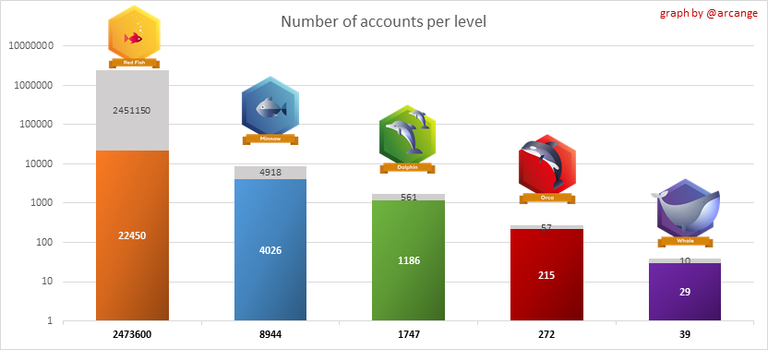 | 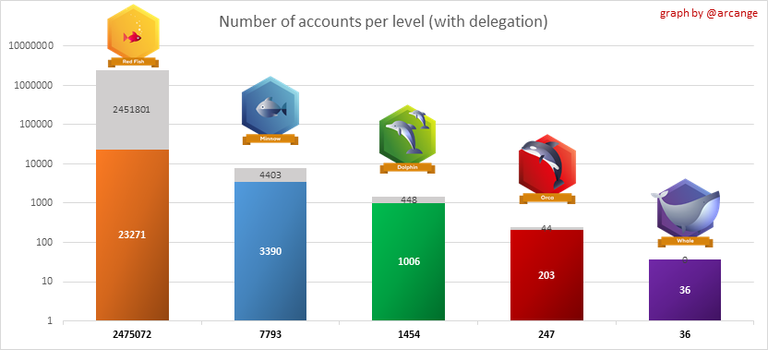 |
These graphs show the number of users according to their Hive Power. The left graph shows the distribution without taking into account any delegation made or received by the accounts. The right graph takes into account delegation, adds received HP delegation and subtracts given HP delegation.
The grey part of each column indicates how many accounts are inactive (those who have not posted, commented or voted the last 30 days).
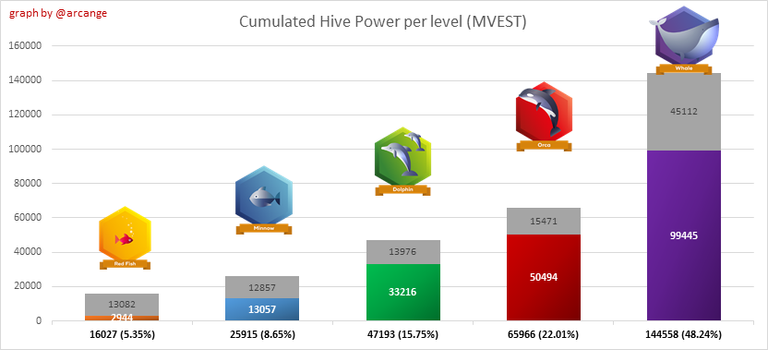 |  |
This graph shows the distribution of Hive Power cumulated per account level. The left graph shows the distribution without taking into account any delegation made or received by the accounts. The right graphs take into account delegation, adds received HP delegation and subtracts given HP delegation.
The grey part of each column indicates unused Hive Power by inactive accounts (see above the definition of inactive).
Below each column, you will also see a ratio to all existing Hive Power.
9. Payouts

This graph shows the highest reward paid on a post (or comment) for the last 30 days.
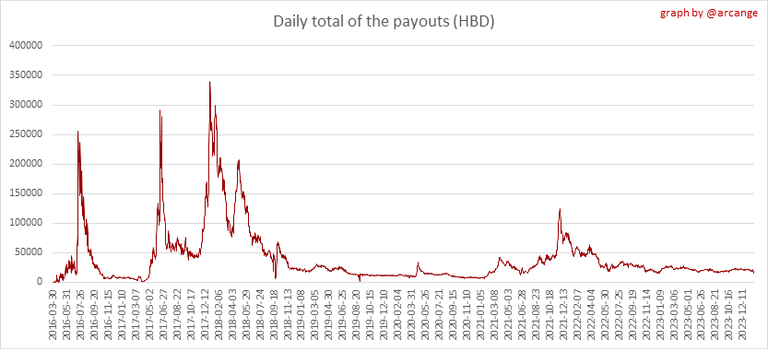 | 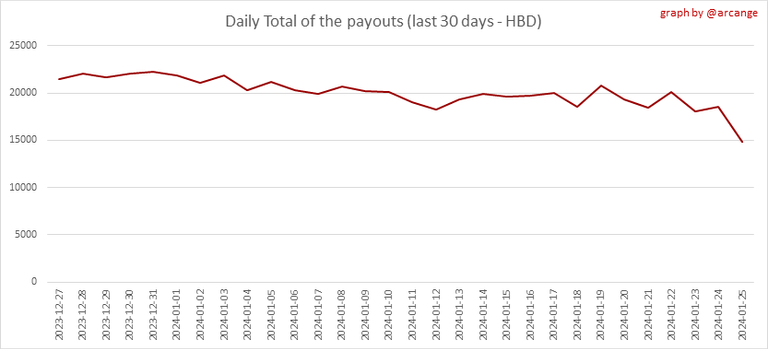 |
These graphs show the total of the distributed payout (posts and comments) for each day.
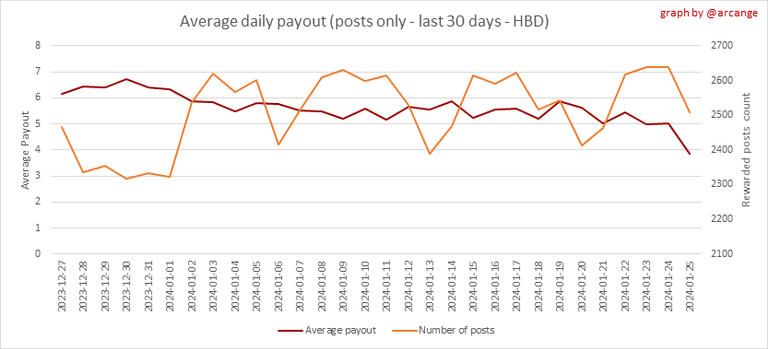 |  |
These graphs show the average and median payout per post for the last 30 days.
I hope you find those stats useful. If you would like to see additional stats, feel free to drop me a comment. Your feedback is welcome.
Thanks for reading.
Check out my apps and services


arcange, pixresteemer sent you LUV. 🙂 (2/10) tools | trade | connect | daily
Made with LUV by crrdlx.
Very interesting article display.
what a shit show... pardon my French... I mean if I have to be blunt here while the rest of the market was pumping for a good two months if not longer all hive did was fall. We need to seriously double check expenses if they are worth it and why the userbase continues to fall. (I suspect a good bit of that has to do with price action as it has in the past)
I understand your concern. It's true that the performance of Hive in the market has been less than stellar recently. However, it's important to remember that market movements are influenced by a wide range of factors, many of which are outside our control. As for the userbase decline, there could be multiple reasons and price can indeed be one of them.
When you talk about expenses, are you thinking of a particular type of expense?
Mainly expenses from the DHF but it looks like we have recently started to bring that a bit more under control and expect value to be returned for the expenses being paid out from the DHF at least to a better extent at the moment then what they have been. I'm hoping we as a community to continue to keep that in mind when voting on proposals.
Thanks for the information
Nice one!
Thank you so much for writing this I love seeing and reading what you write
Thank you @waliphoto
!BEER